Dyn365CE
Exam AB-410: Intelligent Applications Builder Associate
Time for another exam post (I’ll actually be doing 2 posts around new exams this week), this time around building ‘AI Applications’. This is…
Time for another exam post (I’ll actually be doing 2 posts around new exams this week), this time around building ‘AI Applications’. This is…
Introduction This tutorial delves into integrating PowerApps Component Framework (PCF) controls with host form data within Microsoft Power Platform’s model-driven apps. This article will…
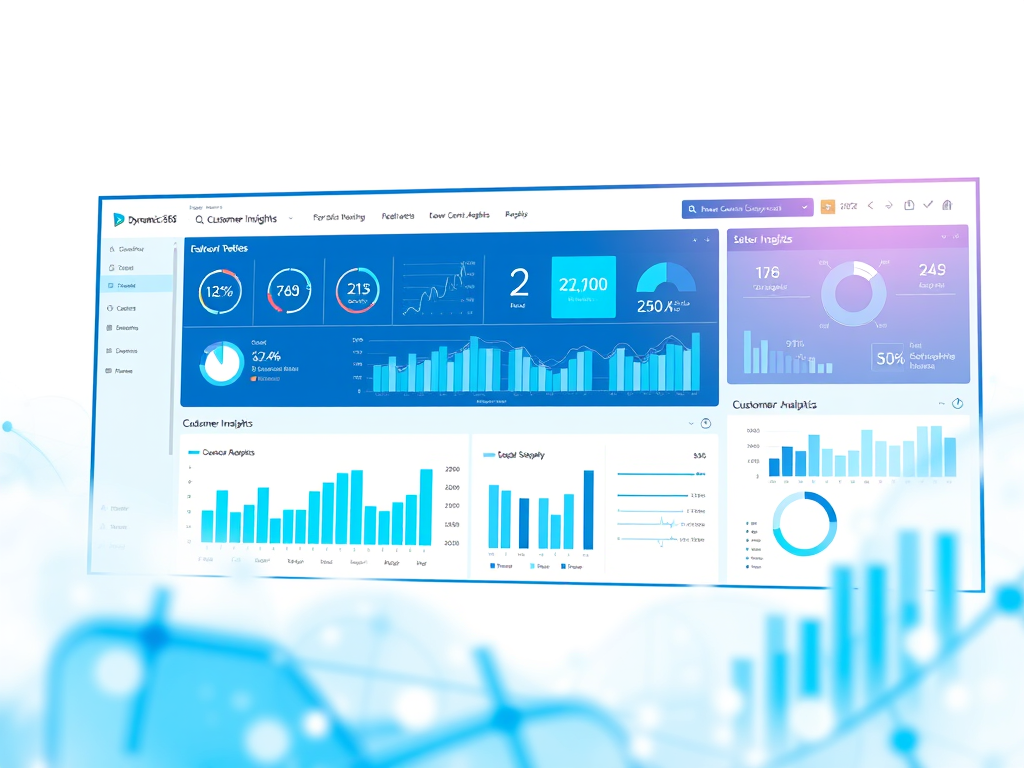
All the new features coming for Dynamics 365 Customer Insights – Data for release wave 1 2025 is now out! Where CI-Journey have nothing…
Land your dream data science job! This video covers 5 essential topics you must learn for a successful data science interview. We discuss key…
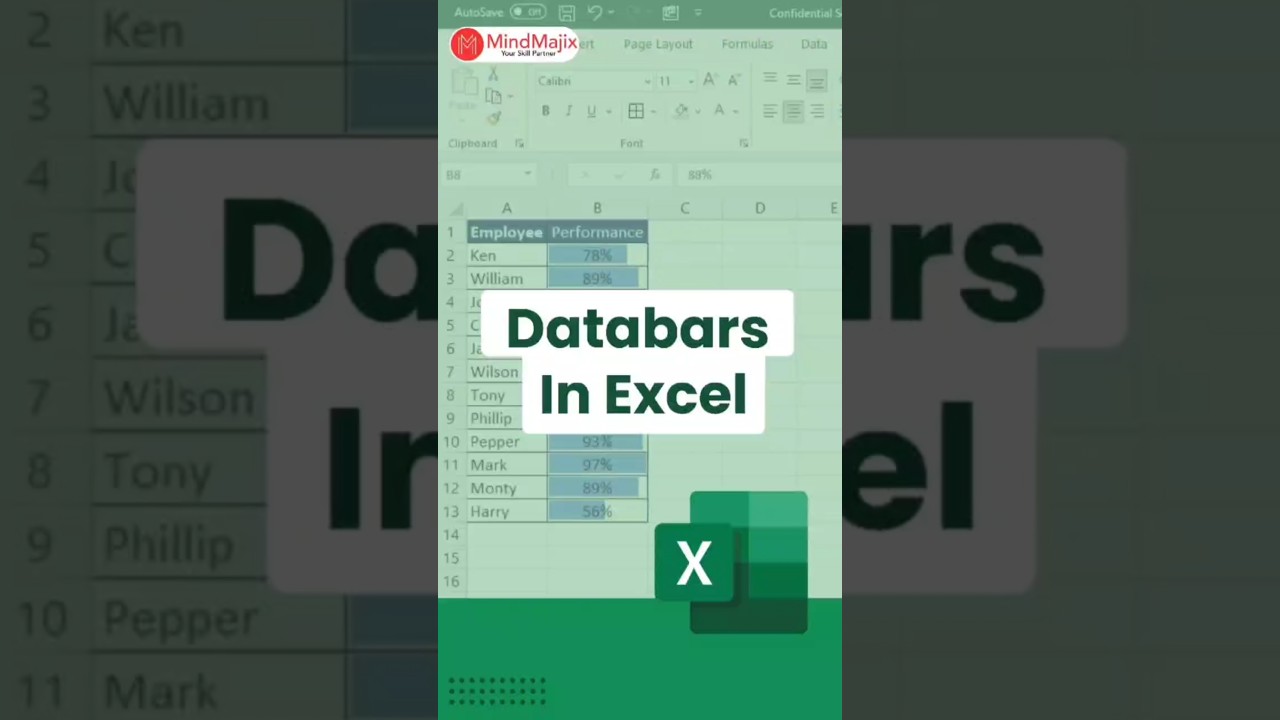
This #short video guides you through the process of creating dynamic data bars in Microsoft Excel. You’ll learn how to add data bars to…