
A generative page is React code that an agent wrote on your behalf. Which means that the first time one fails in front of a user, somebody is going to be debugging code they did not write, from a bug report that says “the page is blank”, with no telemetry of any kind to go on. That was the situation until the end of September, when the generative pages documentation picked up a new section that changes it: published generative pages now send their own page loads, crashes and data calls to Azure Application Insights, and neither you nor the agent has to write a single line of telemetry code to make that happen.
That’s right! No SDK, no connection string, no trackException() sprinkled through generated code that the next prompt will happily rewrite anyway.
Background
The change landed on September 28, 2026 in two articles at once: Generate a page using natural language, which covers the in-browser experience, and Create and edit generative pages with AI code generation tools, which covers building pages from GitHub Copilot CLI and similar tools. Both gained a section titled Monitor a generative page with Application Insights (preview), and the second one is explicit that it works the same whether the page came out of the maker portal or out of a coding agent on your laptop.
For those new to the term, a generative page is a model-driven app page you describe in plain English and an agent produces as React and TypeScript, talking to Dataverse through an object called dataApi. Application Insights is the Azure Monitor service that stores telemetry in fixed tables you query with Kusto Query Language (KQL).
The new telemetry maps onto those standard tables as follows:
- pageViews: completed page loads, with the page ID, page name, app, host type, load duration and navigation origin. Navigation started from a generative page also lands here, with source and target page information.
- exceptions: unhandled page-rendering errors and unhandled promise rejections attributed to the page.
- dependencies: the duration and result of supported
dataApioperations, meaning create, update, delete, retrieve and query.
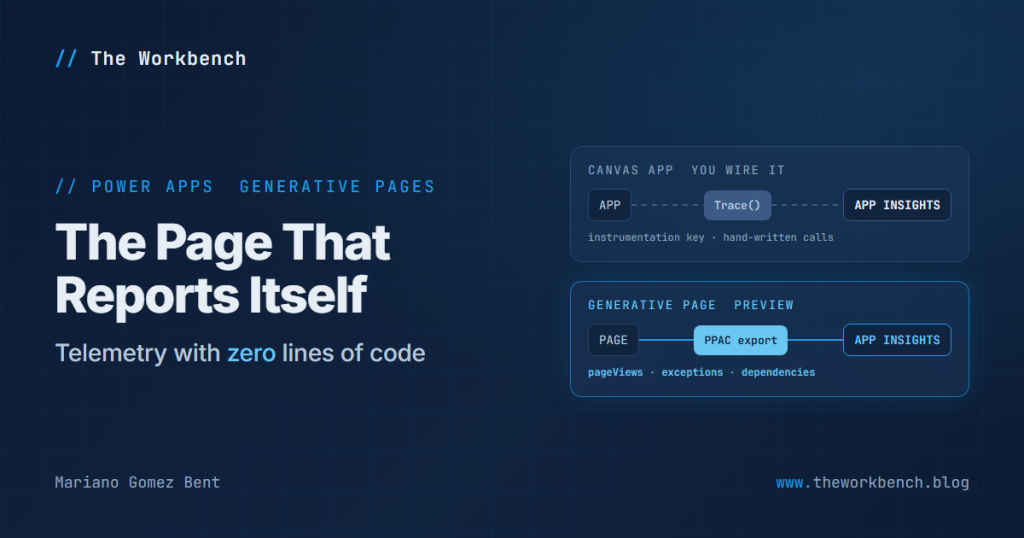
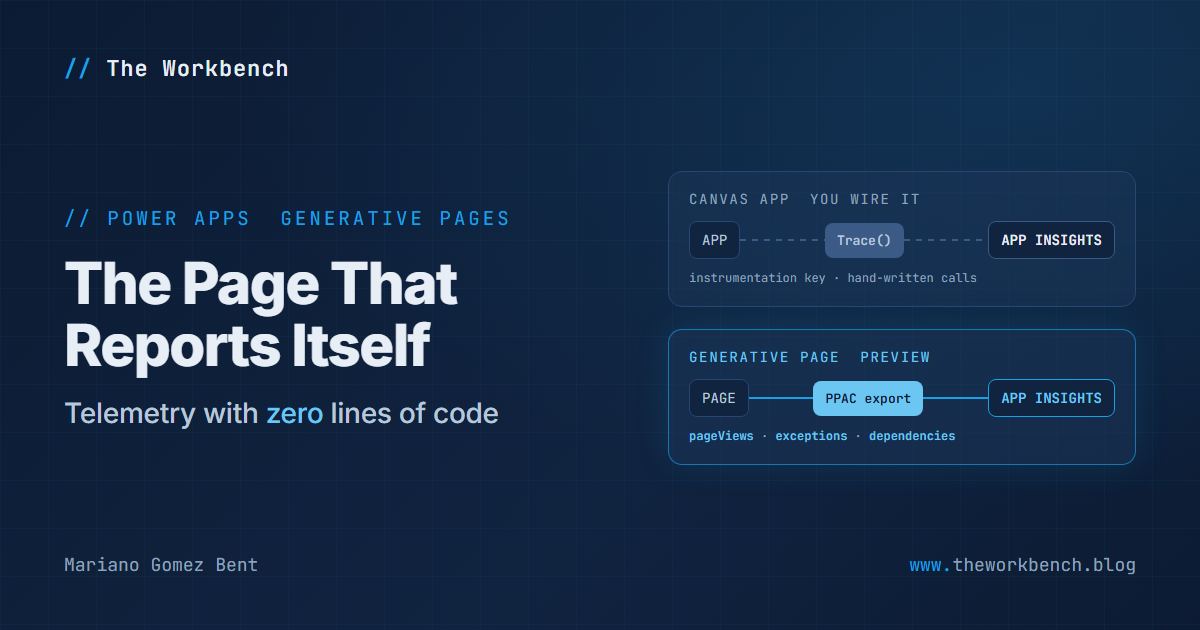
This is the third time I have written about Application Insights on this blog, and the three posts make a neat little timeline. Back in August 2021 I covered monitoring canvas apps with Application Insights, where the maker pastes an instrumentation key into the app and calls Trace() by hand. On August 24th of this year I covered cloud flow telemetry down to the action level, which is a platform export configured by an administrator. Generative pages take the second road, not the first. That’s always a good thing, and here is why.
Why it matters
For makers. You get a straight answer to “is my page working for people?” without learning anything about instrumentation. The catch is that you probably cannot turn it on yourself: the export is configured in the Power Platform admin center by an administrator, and it is supported for Managed Environments only. In a plain developer environment there is nothing to switch on, and you’ll need a conversation with whoever runs your tenant.
For professional developers. The interesting part is the dependencies table. Every dataApi call the agent generated is timed and recorded with its result, so “which query is slow” stops being a guess. And because the platform does the instrumenting rather than the page, it survives regeneration. If you have ever added logging to generated code and watched the next prompt remove it, you’ll appreciate that more than anything else here.
NOTE: this is a preview, and the docs say availability might vary by environment while it rolls out. The platform’s delivery commitment for exported telemetry is 24 hours, so an empty table on the first afternoon is not a failure.
The demo
The demo is small on purpose: one generative page, one Application Insights resource, one deliberately broken button, and four queries. The broken button is what makes it convincing, because a page that works only proves that page loads are recorded. To prove crashes are, you have to crash it.
Once the page is generated, open the Code tab, select Edit, and add a button whose click handler throws inside an async function:
<button
  type="button"
  onClick={async () => {
    // Deliberate failure for the telemetry demo. Remove before sharing the page.
    throw new Error("Telemetry smoke test: unhandled promise rejection");
  }}
>
  Break me
</button>
Because the handler is async, the thrown error does not surface as an ordinary exception: it becomes a rejected promise that nothing catches, which is precisely one of the two error classes the docs say are recorded. I used a plain HTML button rather than whatever component library the agent picked so it pastes cleanly into any generated page. Change the message text to something you can search for, and select Save to commit the edit as a new iteration.
Steps to recreate
The admin center path below comes straight from Export data to Application Insights, and the page steps from the generative pages article. Be sure to read the prerequisites first, because each one can stop you cold:
1) In the Azure portal, create an Application Insights resource dedicated to this environment. The docs warn that the out-of-the-box reports misbehave if one resource receives data from several environments, and that the integration requires local authentication to remain enabled on the resource. Make sure you hold Contributor or Owner on it.
2) Confirm that the Power Platform environment is a Managed Environment, and that you hold Power Platform administrator or Dynamics 365 administrator at the tenant level and System Administrator in the environment itself. Both are required.
3) Go to the Power Platform admin center > Manage > Data export > App Insights tab > New data export.
4) Enter a friendly name and pick the data type. Here is a gap worth knowing about: the generative pages articles do not say which data type carries their telemetry. The documented choices include Dataverse diagnostics and performance, Power Automate and Copilot Studio, and model-driven app telemetry is documented under the Dataverse diagnostics feed, so that is the one I would select. Treat that as my inference until the docs say so.
5) Choose your filters and the source environment, select Next, choose the subscription, resource group and Application Insights resource, select Next, then Create.
6) Go to make.powerapps.com, open a model-driven app for editing, and in the app designer select Add page > Generative page > Describe a page. The in-browser experience requires an environment in the United States, Great Britain, Australia or Singapore; elsewhere, use the AI code generation tools route instead.
7) Describe the page (the companion repo has an example prompt if you would rather not write one), select Add data > Add table to link a Dataverse table (Account is fine), then select Generate page. Add the broken button from the previous section on the Code tab.
8) Select Save and Publish. Only published pages send telemetry, so a page you have only previewed in the designer will stay silent.
9) Open the app as a normal user, load the page several times, page through some records, and click Break me twice. Then wait, up to a day the first time.
The queries
Start by looking at what actually arrives, before writing anything clever. The documentation names the information each row carries but not the column or customDimensions key each value lives in, so the first query is reconnaissance:
union pageViews, exceptions, dependencies
| where timestamp > ago(2d)
| where cloud_RoleInstance == "CDS Data Export"
| project timestamp, itemType, name, duration, success, operation_Id, session_Id, customDimensions
| order by timestamp desc
| take 50
The cloud_RoleInstance filter is the documented marker for rows written by the Power Platform export, which keeps anything else your resource collects out of the picture. Read the customDimensions column carefully on a few pageViews rows: that is where you will learn the actual key names for page ID and page name, and you will need them for anything you build on top. If the filter returns nothing while the unfiltered version returns your page, drop it and note the value you see instead.
Next, page load performance per page:
pageViews
| where timestamp > ago(7d)
| where cloud_RoleInstance == "CDS Data Export"
| summarize loads = count(), p50 = percentile(duration, 50), p95 = percentile(duration, 95) by name
| order by p95 desc
This groups by the standard name column. If the reconnaissance query showed the page name living in customDimensions instead, replace by name with by pageName = tostring(customDimensions["<key you found>"]). The 95th percentile is the number to watch, since an average hides the users who are having the worst time.
Then, the crash you caused on purpose:
exceptions
| where timestamp > ago(7d)
| where cloud_RoleInstance == "CDS Data Export"
| summarize occurrences = count(), users = dcount(user_Id), lastSeen = max(timestamp) by problemId, outerMessage
| order by occurrences desc
Your “Telemetry smoke test” message should show up in outerMessage with two occurrences. The users column is the one that turns a crash list into a priority list: one user hitting something forty times is a very different conversation from forty users hitting it once. Wire this query to an Azure Monitor alert rule and you have crash notification for code nobody on your team wrote.
Finally, the data calls:
dependencies
| where timestamp > ago(7d)
| where cloud_RoleInstance == "CDS Data Export"
| summarize calls = count(), failed = countif(tobool(success) == false), p95 = percentile(duration, 95) by type, name
| order by p95 desc
Run this before filtering on type. The docs do not list the type value used for dataApi operations, and Dataverse’s own server-side calls also land in dependencies, so let the first run tell you which value belongs to your page, then add a where type == "..." line. The tobool() is not decoration: the classic dependencies table documents success as a string, and only the workspace version of the table (AppDependencies) makes it a true bool, so a bare success == false would compare two different types. A retrieve that is consistently slow at the 95th percentile is usually a query asking for every column of a large table, which is something you can fix with one more sentence in your next prompt.
Companion repo
Everything in this post is packaged in genpage-telemetry-lab on GitHub. The README.md carries the prerequisites and the admin center path from above, the queries folder holds the four KQL files numbered in the order you should run them (reconnaissance first), and the page folder holds an example generation prompt and the broken-button snippet, ready to paste.
One thing the README covers that is worth repeating here: these queries use the classic Application Insights table names, so run them from Logs on the Application Insights resource itself. Query the underlying Log Analytics workspace instead and the same data lives in AppPageViews, AppExceptions and AppDependencies, under different column names. An Azure Monitor workbook charting the three tables side by side is the natural next addition, and it goes into the repo once the real column names are confirmed against live data, not before.
Final Notes
What I like most about this change is where it put the responsibility. When an agent writes the code, any telemetry inside that code is only as durable as the next prompt. Instrumentation in the platform, configured once and applied to every published page, is the only arrangement that holds up when the page is regenerated every week, and in my humble view it is the right precedent for whatever else gets generated on this platform.
It is a preview with honest gaps in the documentation, chiefly which export data type to pick and which column holds the page name. The reconnaissance query is there so you close those gaps with your own data rather than with assumptions. Then go break a button on purpose. It is the cheapest proof you’ll get that the crash reporting works!
Until next post!
MG.-
Mariano Gomez Bent
Former Microsoft BizApps MVP