Now Reading: Visualize Dataverse Insights Using Code Interpreter in Microsoft Copilot Studio
-
01
Visualize Dataverse Insights Using Code Interpreter in Microsoft Copilot Studio
Visualize Dataverse Insights Using Code Interpreter in Microsoft Copilot Studio
Microsoft Copilot Studio is rapidly transforming how business users analyze data, automate tasks, and create intelligent solutions. One of its most powerful new capabilities is the Code Interpreter, which allows users to run Python code directly within Copilot, without needing developer expertise.
With this feature, users can perform advanced data analysis, process documents (Word, Excel, PowerPoint, PDF), generate charts and visualizations, and receive summarized insights, all through simple natural language prompts. The combination of Python execution + AI reasoning makes Copilot Studio a powerful tool for business analysts, sales teams, data professionals, and low-code makers.
By integrating this capability directly into the Microsoft ecosystem, organizations can accelerate insights, reduce manual analysis effort, and modernize reporting faster and more efficiently.
Business Use Case Example
Imagine a sales representative who needs to analyze customer performance across industries. Instead of manually opening Excel, running formulas, or creating charts, they can simply ask Copilot:
“Show annual revenue by industry for my customers.”
Copilot instantly:
- Pulls customer data from Dataverse
- Runs Python code in the Code Interpreter
- Generates a bar chart showing revenue trends
- Provides a written summary highlighting top-performing sectors
This removes repetitive data tasks from the sales process and enables quick, data-backed decisions by helping teams prioritize high-value opportunities more effectively.
Implementation
Before using the Code Interpreter within prompts or agent flows, it must be enabled in your environment.
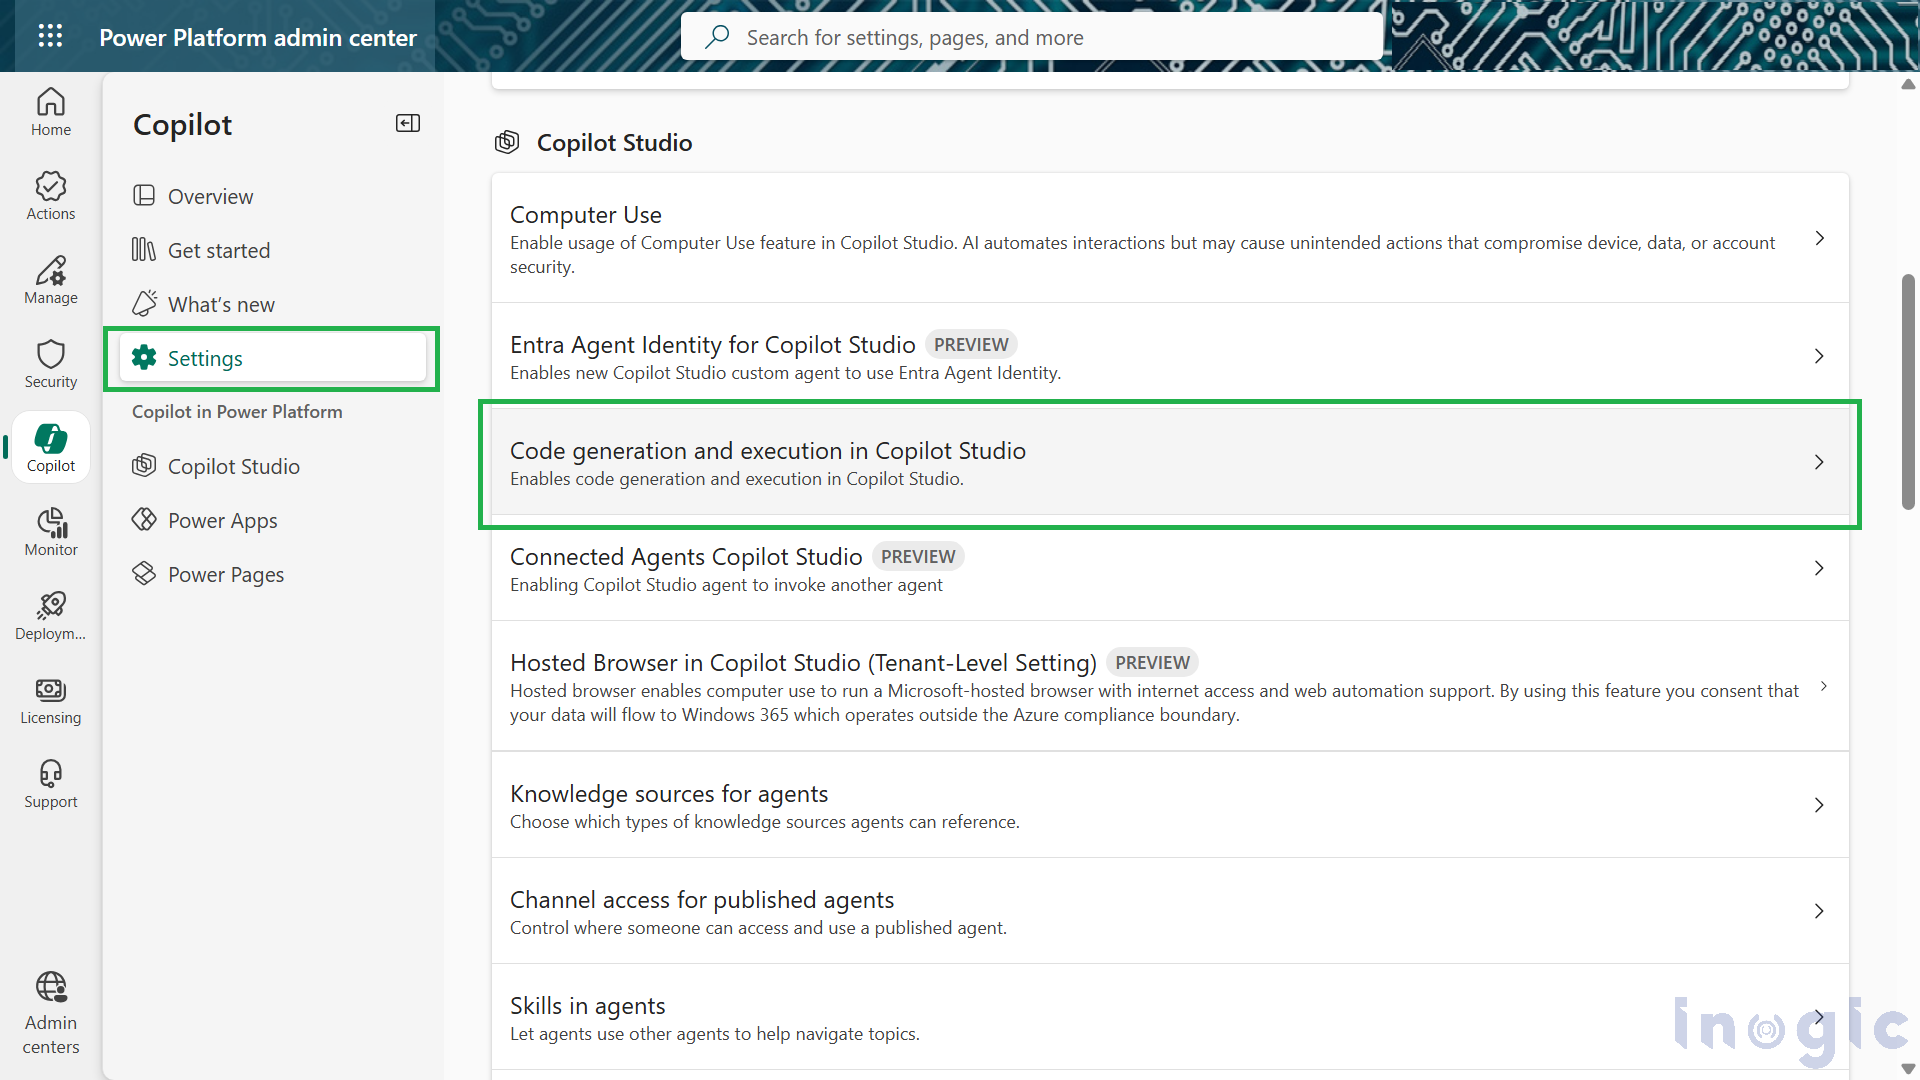
- Go to Power Platform admin center
- Select Copilot → Settings → Code generation and execution in Copilot Studio.
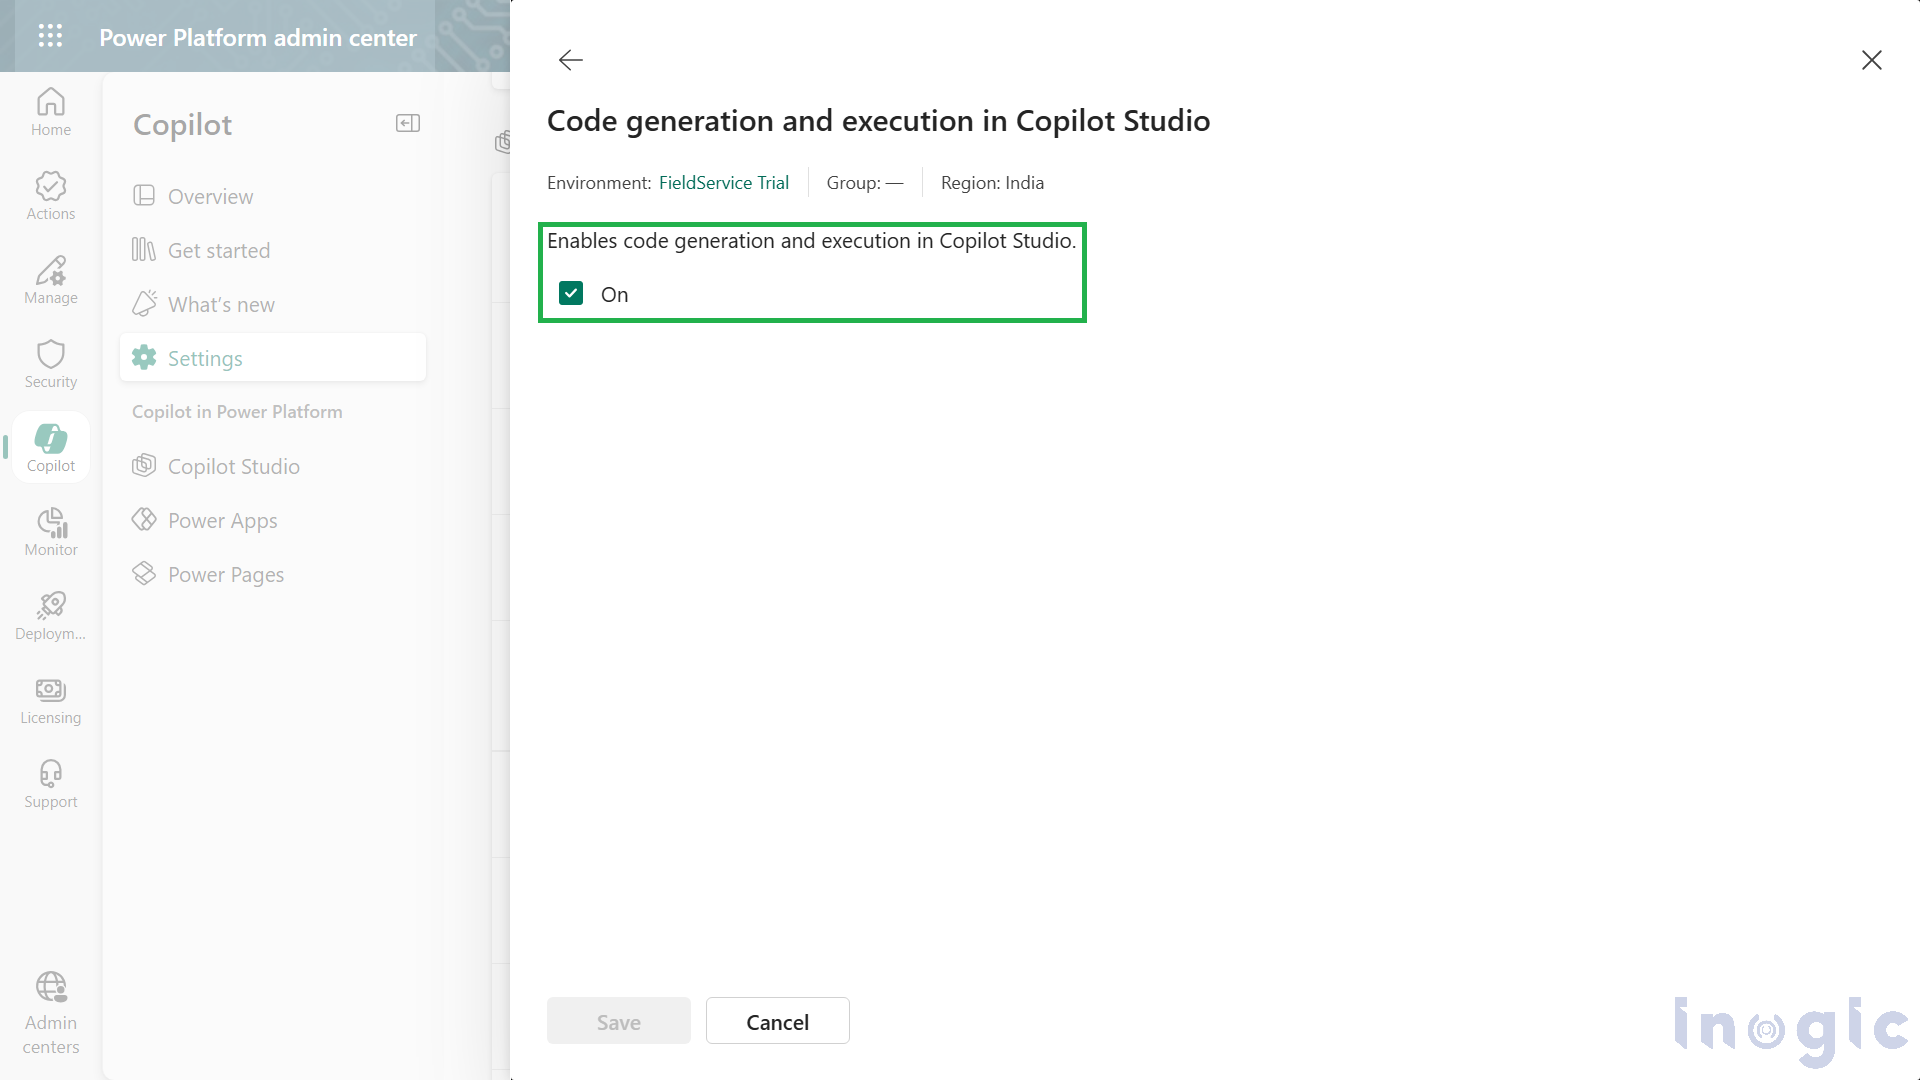
- A pane with list of environments opens. Select the environment and click on Add.
- Select On to turn on code generation and execution in Copilot Studio and save.
Building a Code Interpreter Prompt for Dataverse Visualizations
1. Create the Prompt
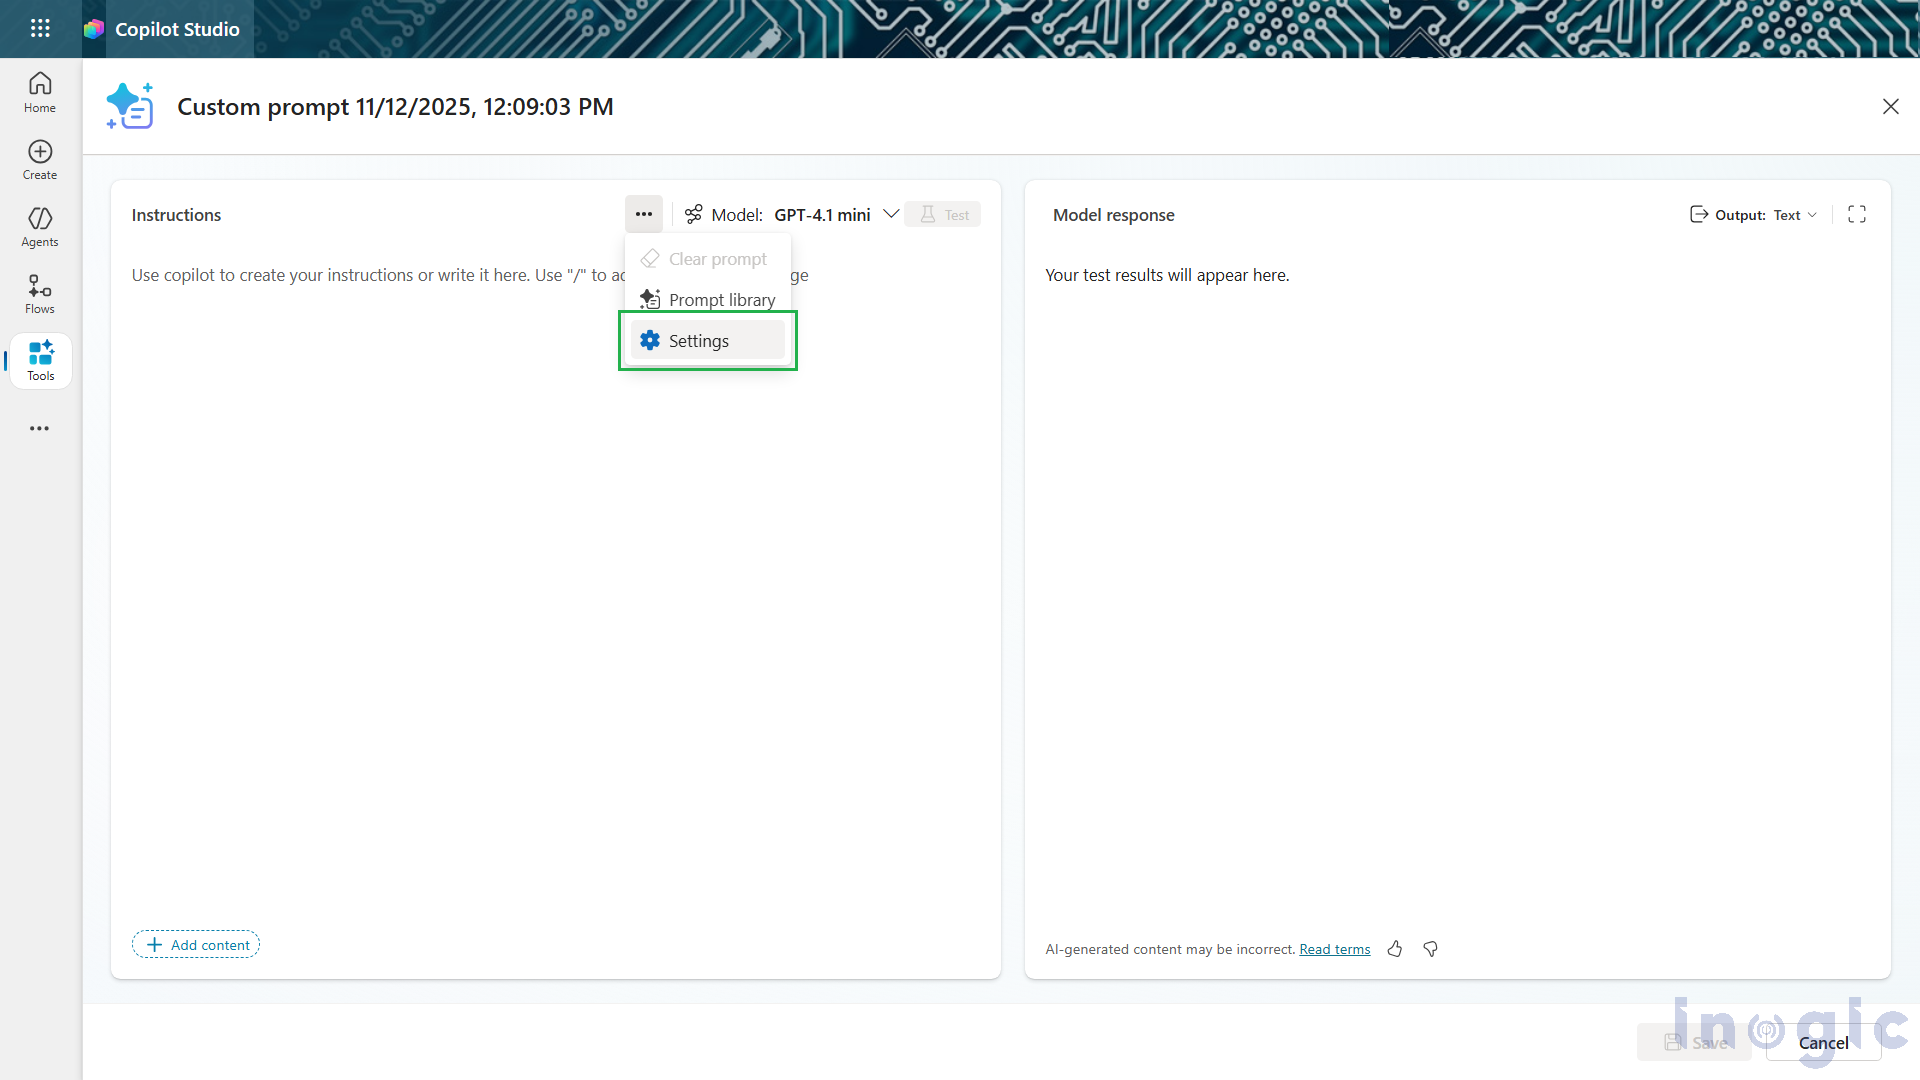
- Go to Microsoft Copilot Studio → Tools → New Tool → Prompt.
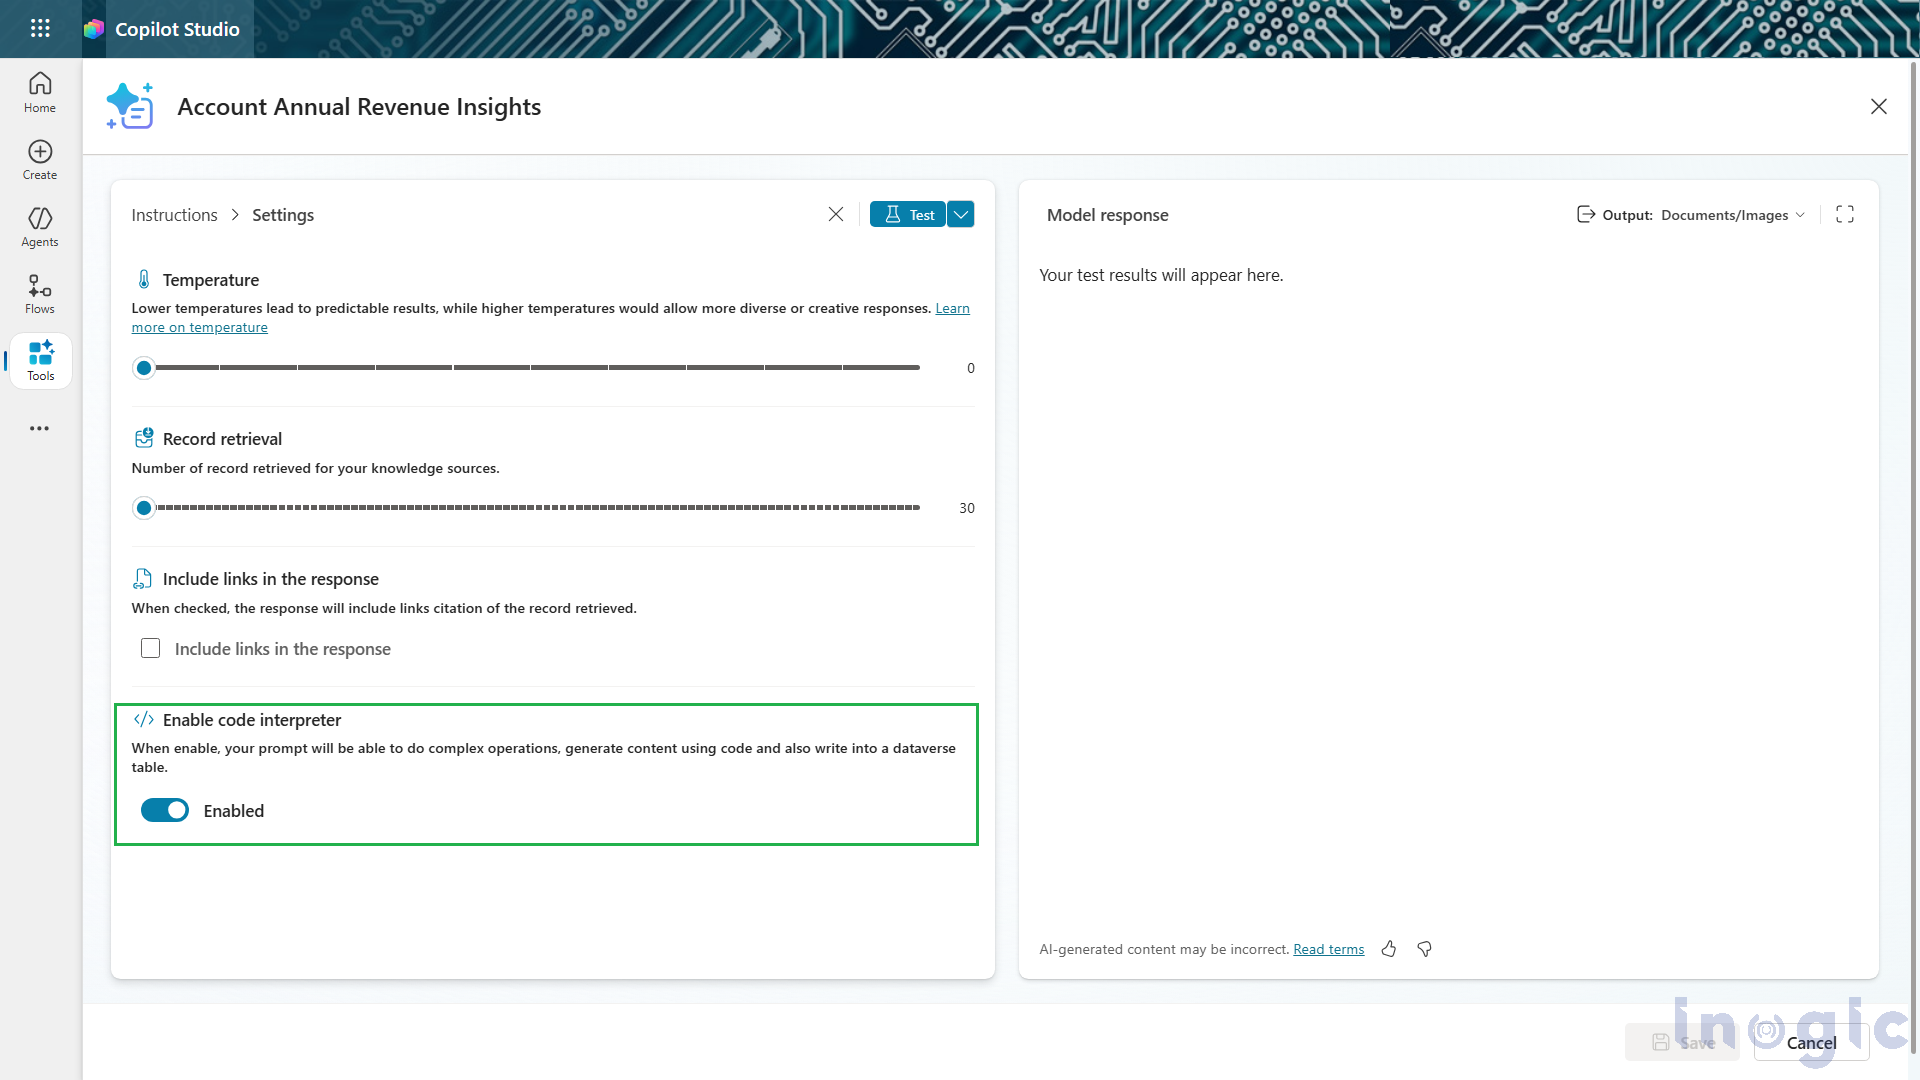
- First, ensure the Code Interpreter is enabled:
- Go to Settings → Enable code interpreter.
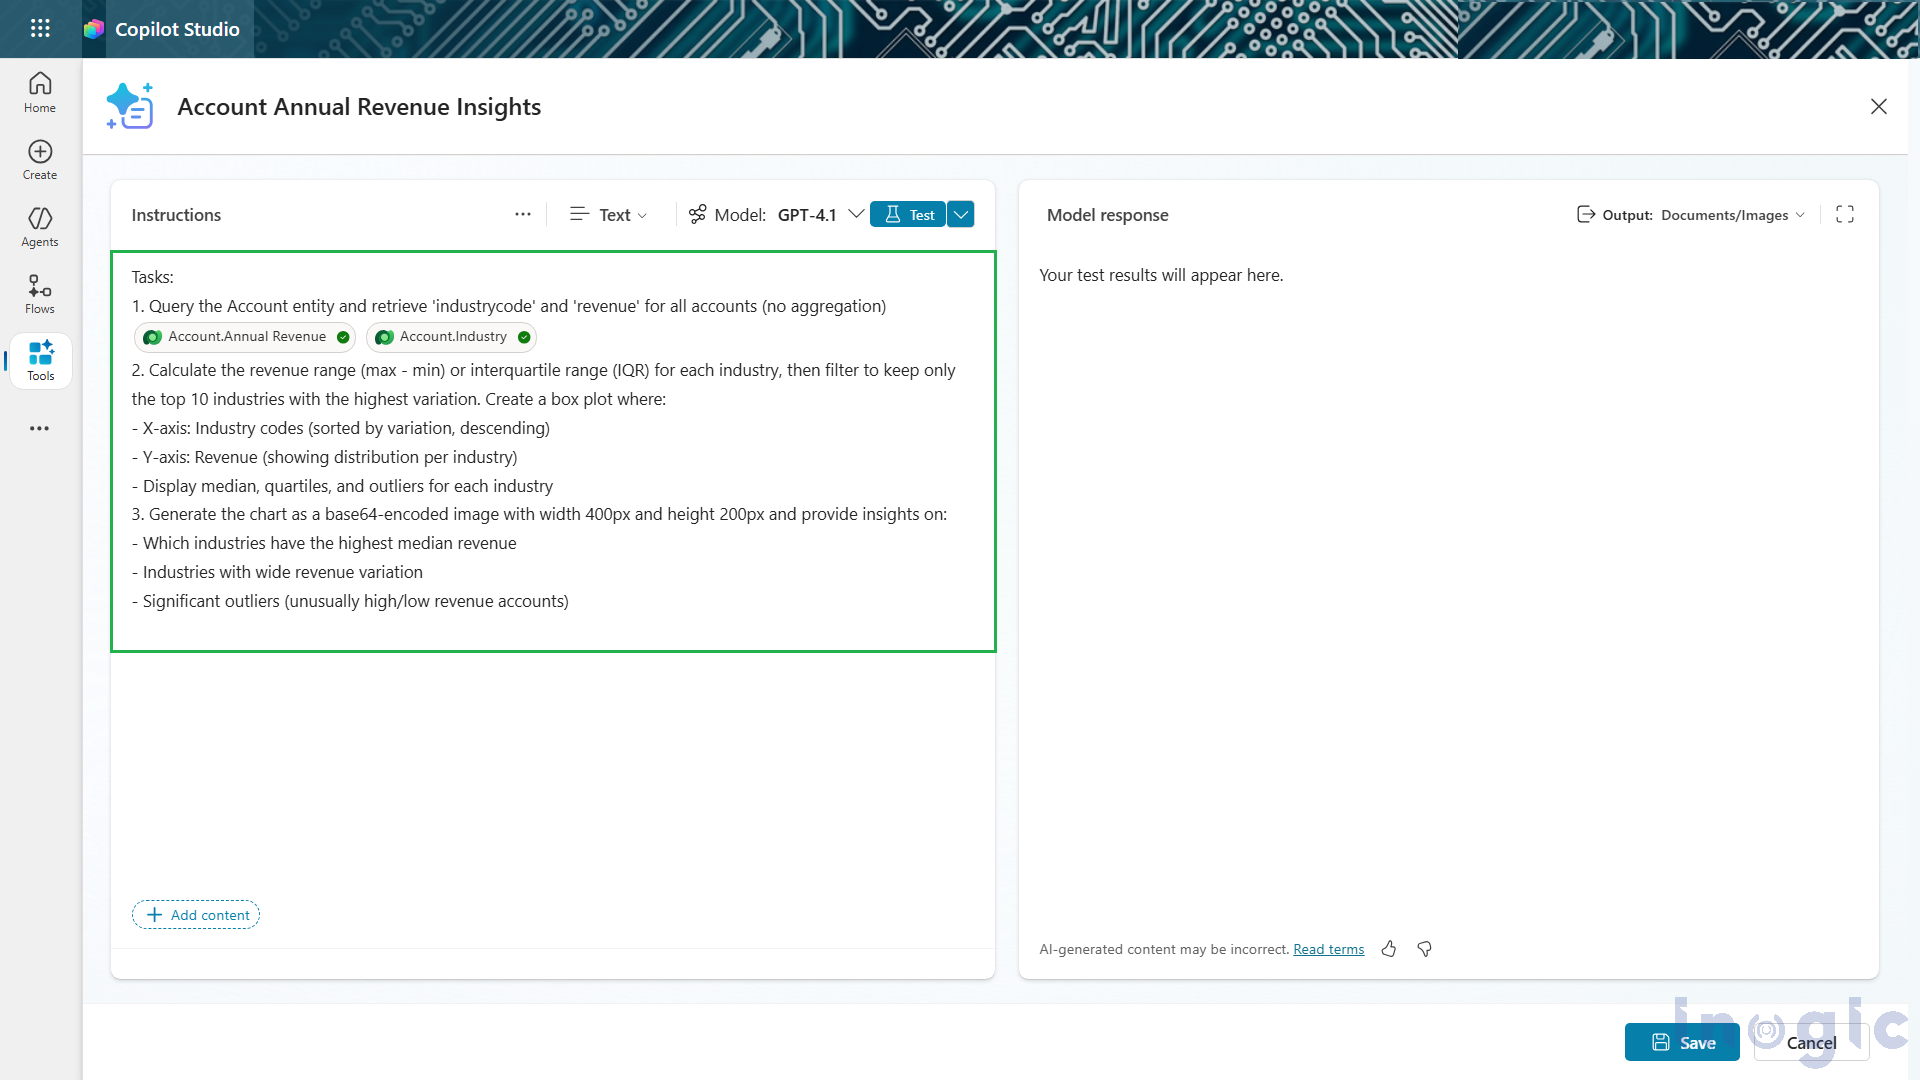
- Add your natural-language instructions.
- Link the prompt to the Dataverse tables you want to analyze.
Integrate the prompt into an agent flow in Copilot Studio
- Add the Prompt to an Agent Flow
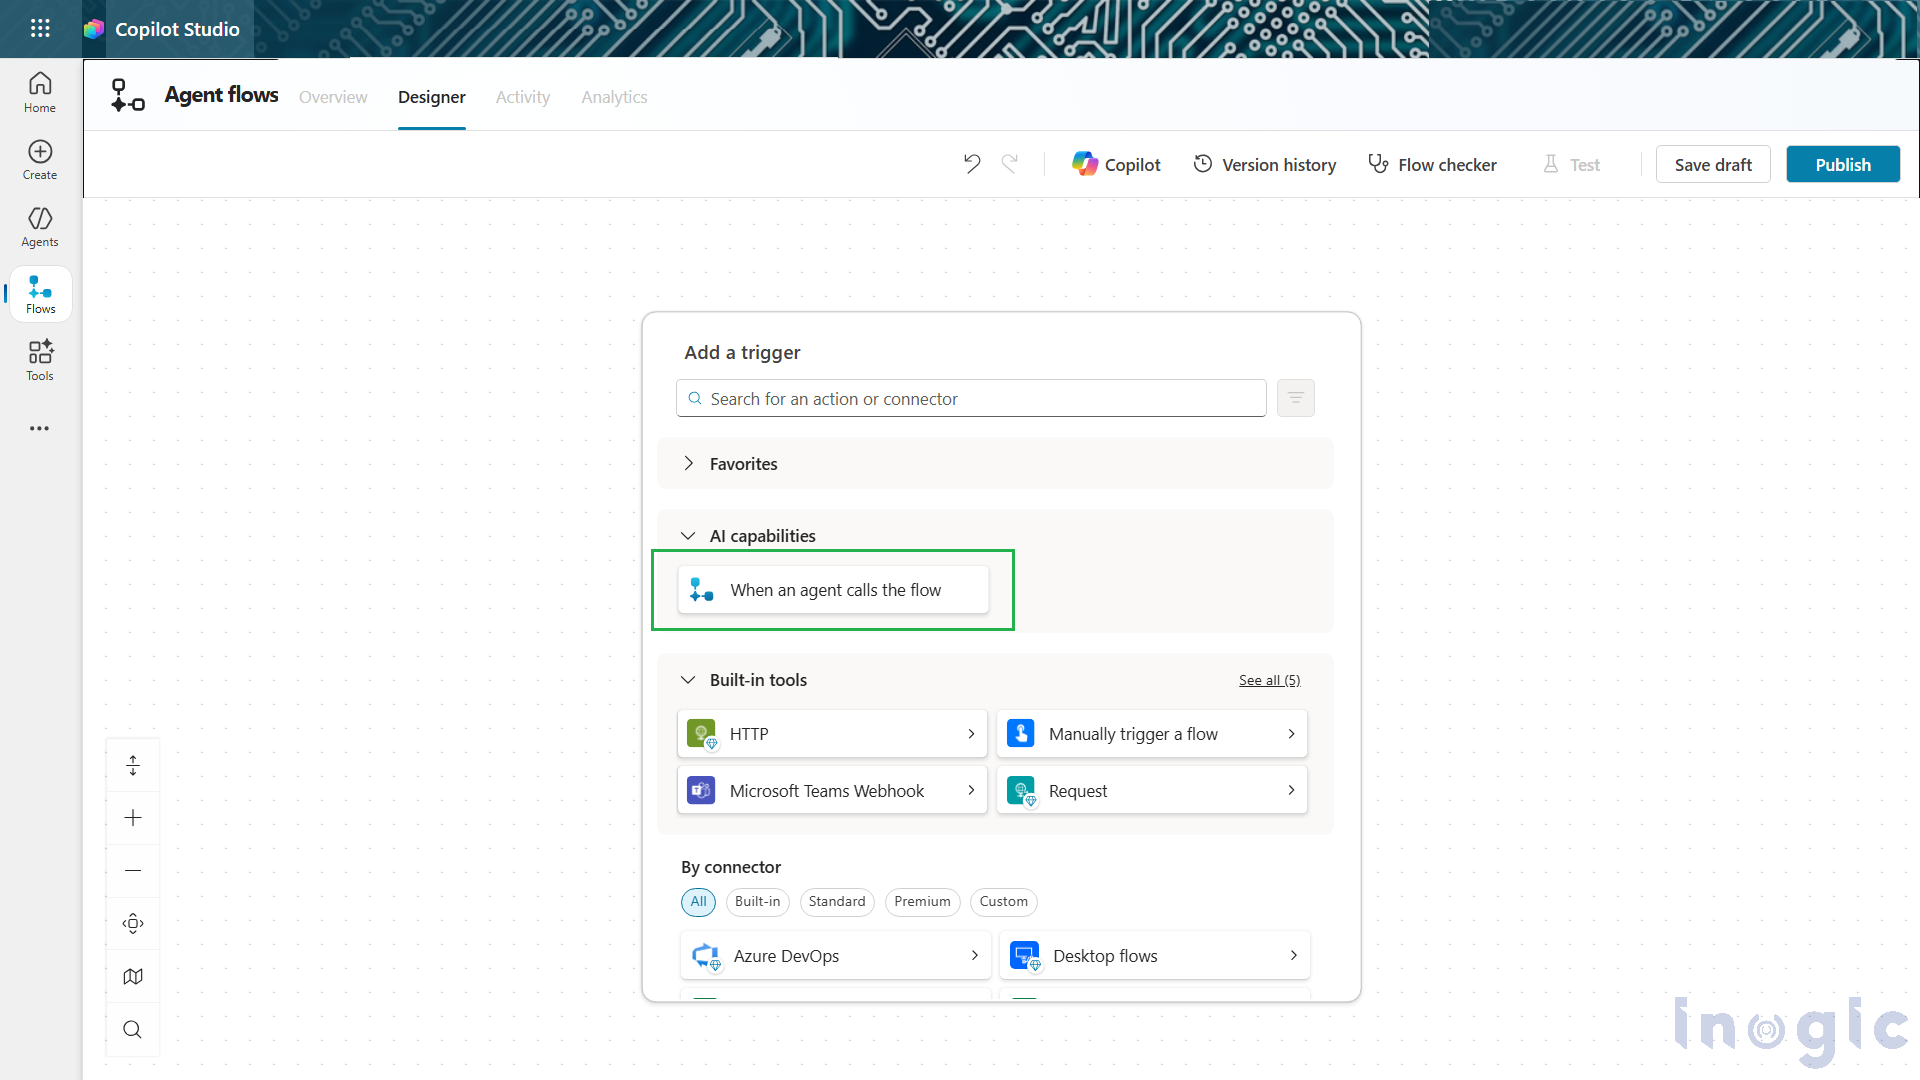
- Go to Tools > Add a tool > New tool > Agent flow.
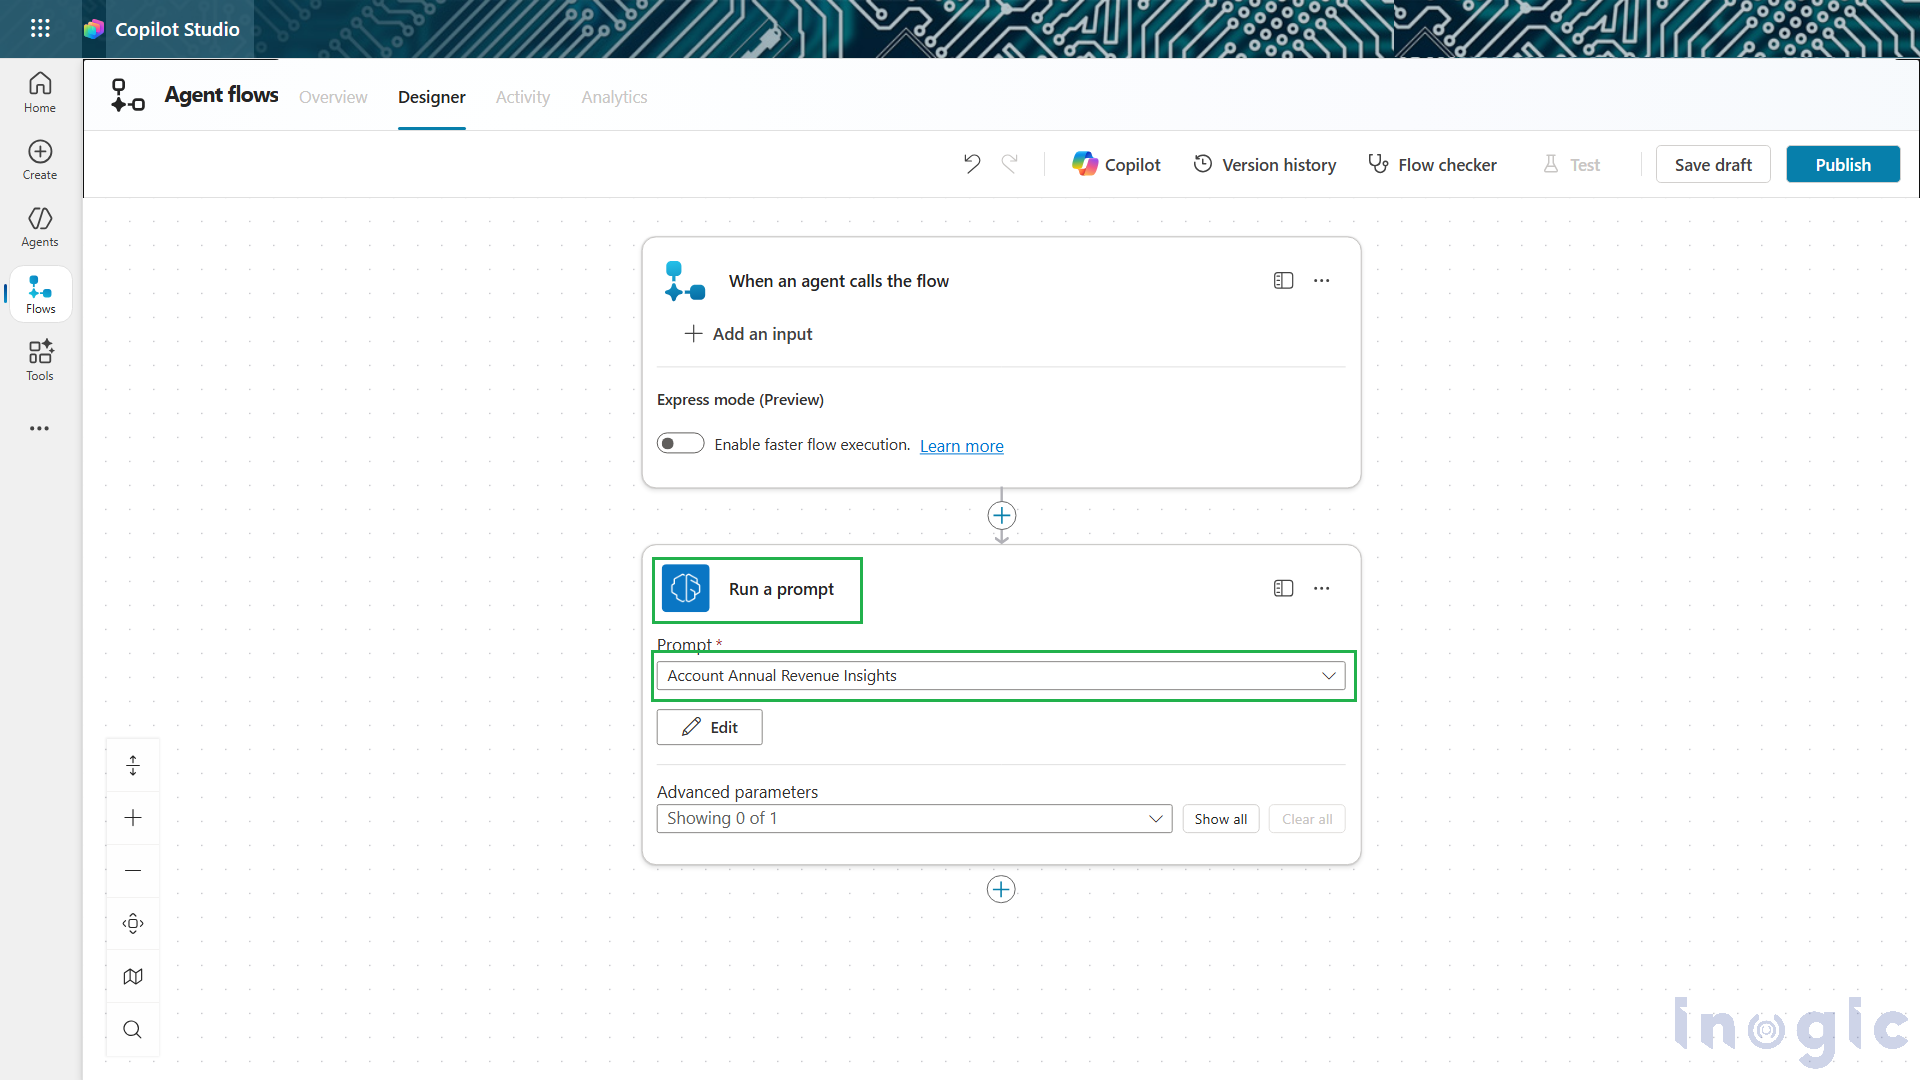
- In the agent flow designer, select When an agent calls as the flow trigger.
- Now add a new Run a prompt action and select the name of the prompt to be used for this flow.
3. Pass Outputs Back to the Agent
- Next, open the Respond to the agent node editor to select parameters to pass back to the agent as outputs.
- Add an output of Text type and use the Insert Expression option to set its value as “outputs(‘Run_a_prompt’)?[‘body/responsev2/predictionOutput/text’]”. This is the string containing the summary that is returned by the prompt.
- Add a second output of Text type and set its value as “first(outputs(‘Run_a_prompt’)?[‘body/responsev2/predictionOutput/files’])?[‘base64_content’]”. This is the string containing the base64-encoded image of the graph.

Publishing the Flow and Displaying Results
4. Publish & Connect
- Save and publish the flow and add it to the agent by going on the Tools page in the agent and selecting the flow.
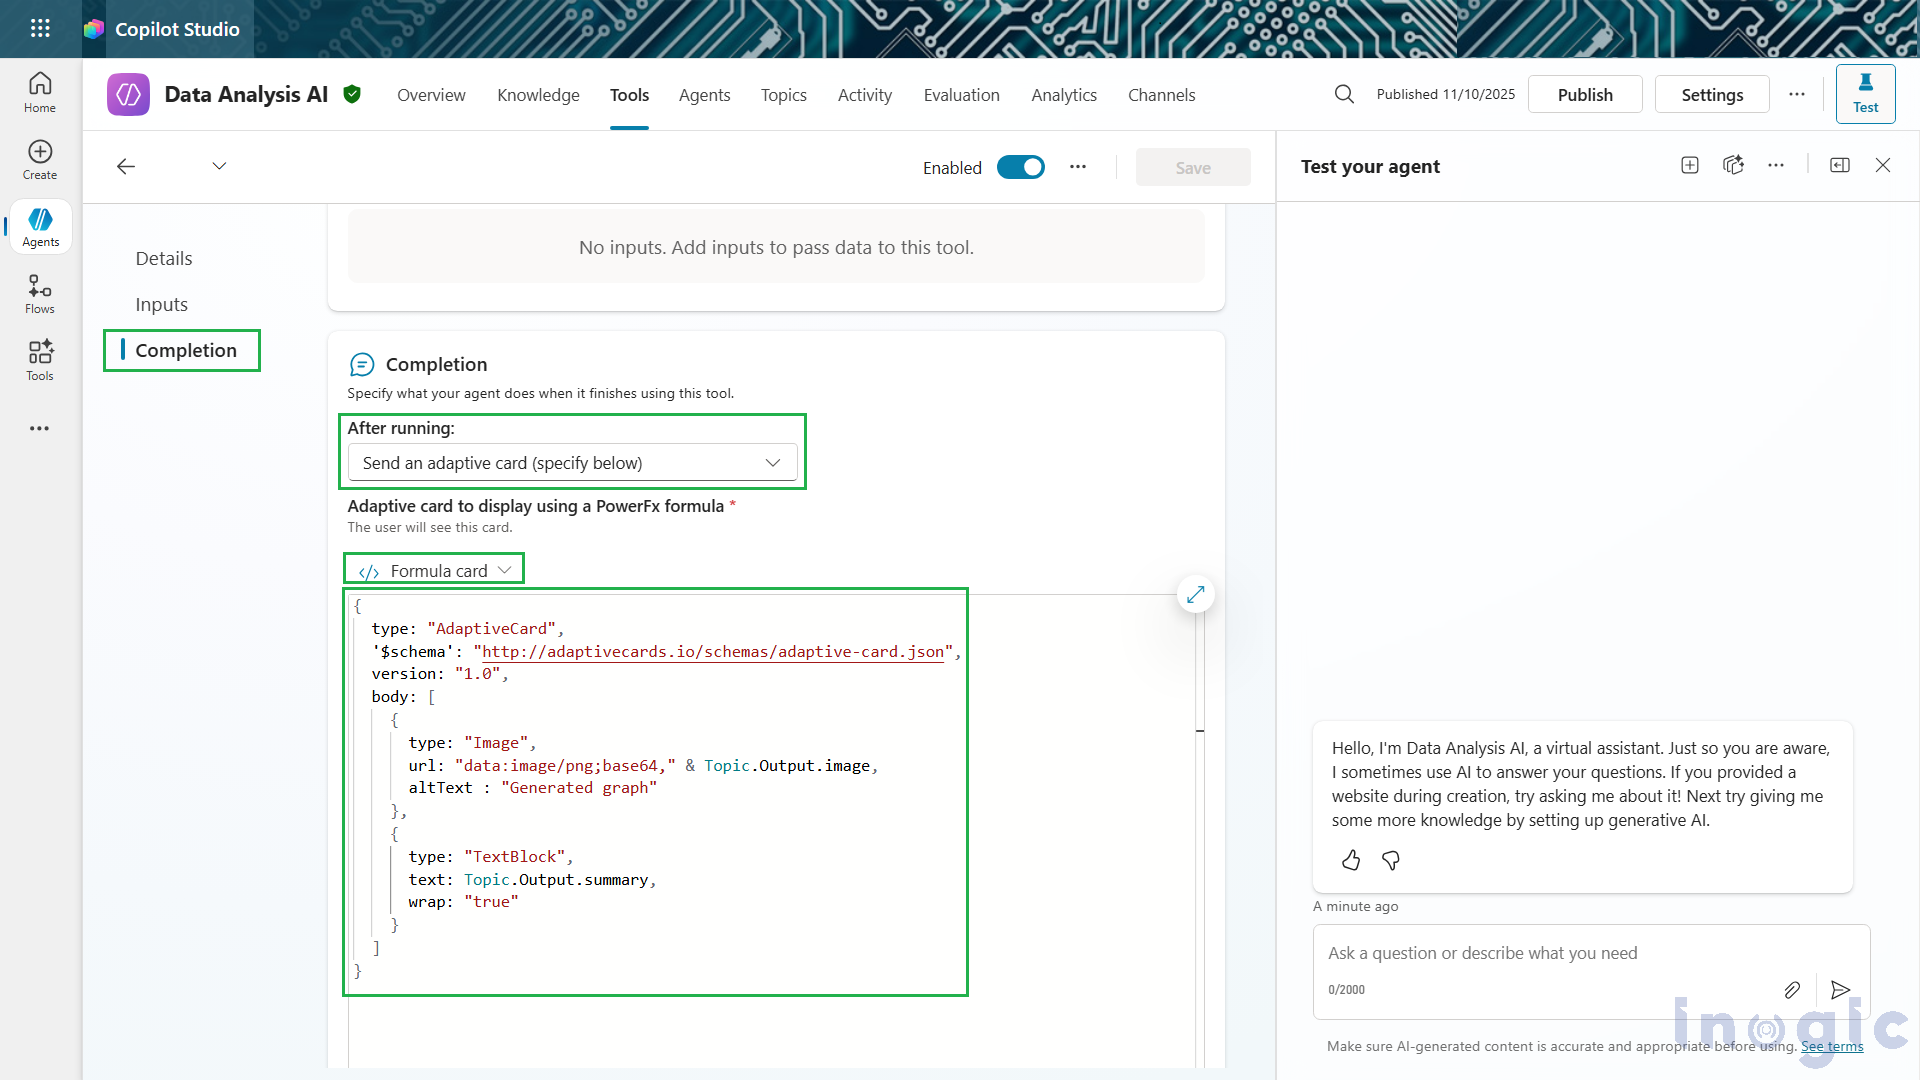
- Now, under the Completion tab, set the After running action to Send an adaptive card (specify below).
5. Add This Adaptive Card Formula
Under Adaptive card to display using a PowerFx formula, select Formula and enter this formula:
{

type: "AdaptiveCard",

'$schema': "http://adaptivecards.io/schemas/adaptive-card.json",

version: "1.0",

body: [

{

type: "Image",

url: "data:image/png;base64," & Topic.Output.image,

altText : "Generated graph"

},

{

type: "TextBlock",

text: Topic.Output.summary,

wrap: "true"

}

]

}
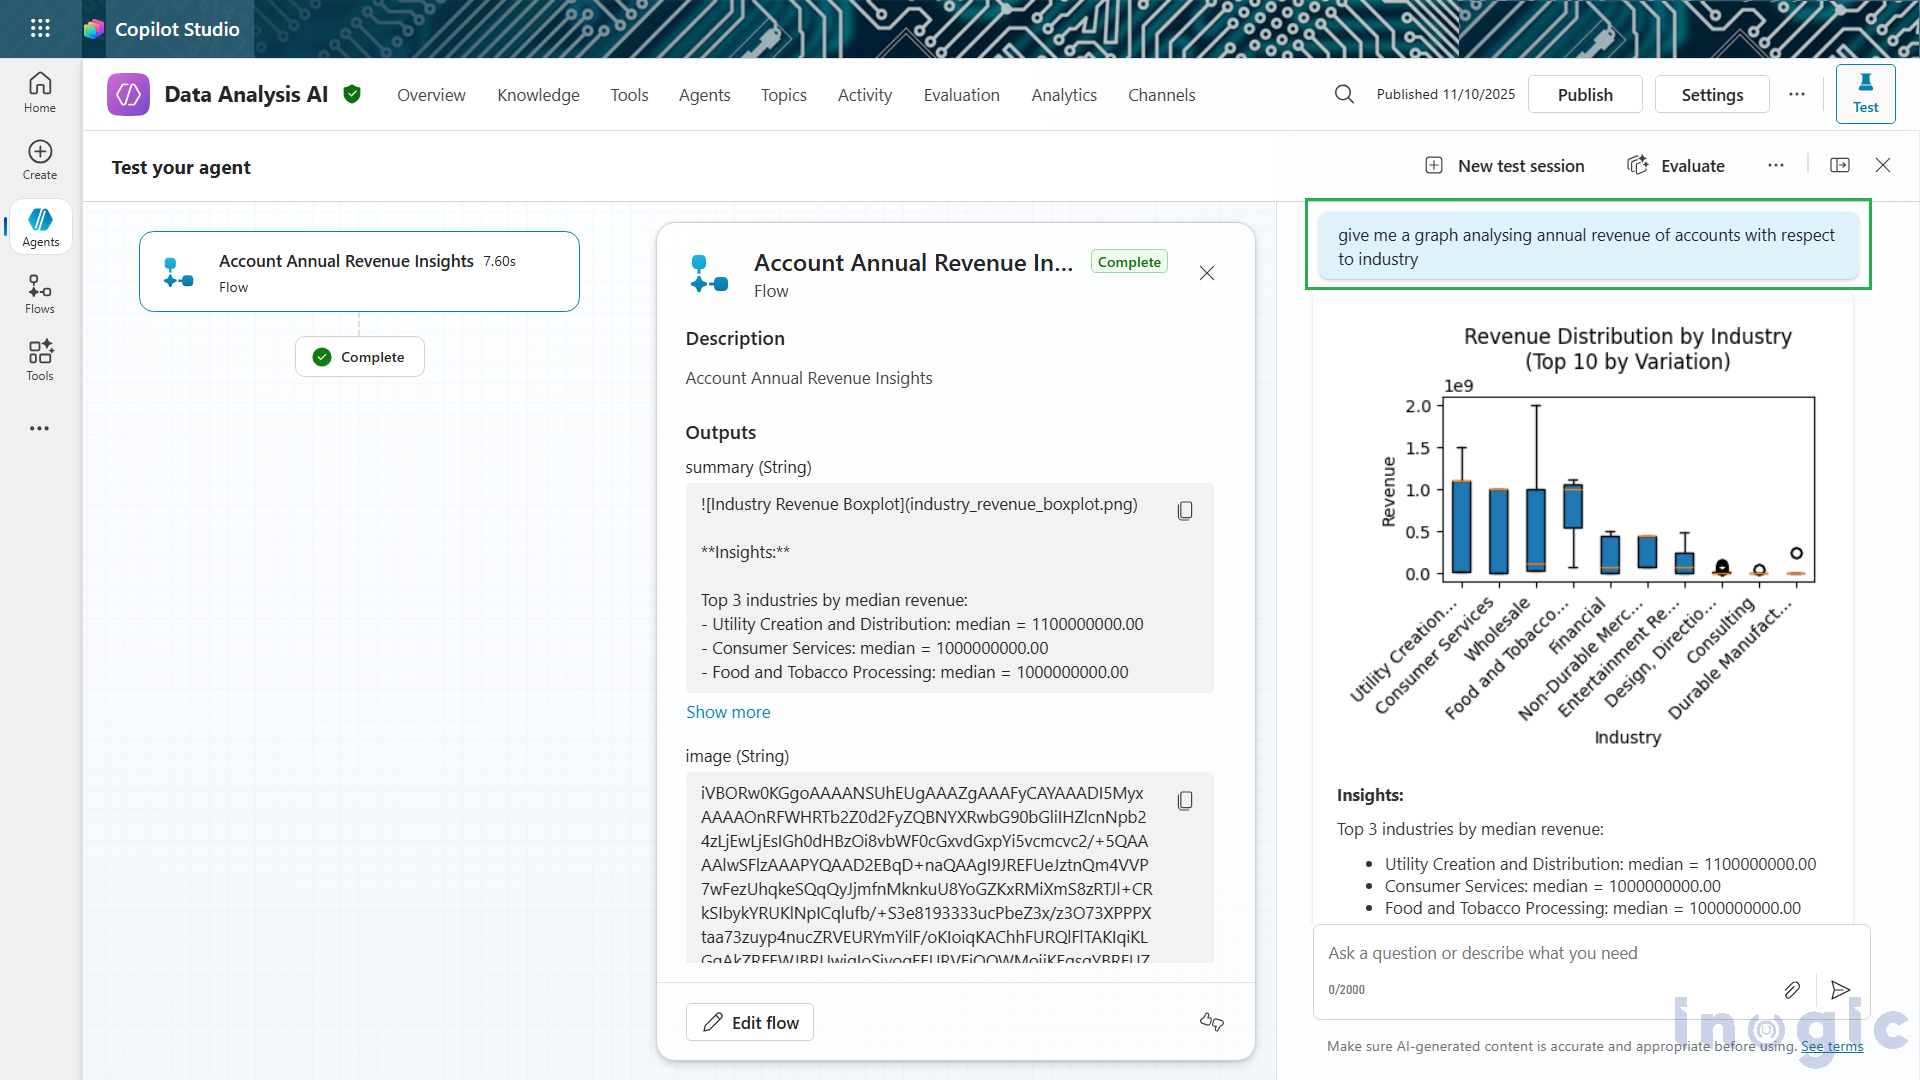
When the user enters a prompt asking for an analysis of annual revenue data, this flow will be executed, returning a box plot. This box plot showcases the median value of annual revenue for each industry and displays the quartiles in the data. This helps visualize the variation in Annual Revenue data with respect to each industry, making it a useful tool for low-code makers to generate insights using AI.
FAQs
1. What is the Code Interpreter in Microsoft Copilot Studio?
The Code Interpreter in Microsoft Copilot Studio is a built-in feature that allows users to run Python code directly inside Copilot. It enables advanced tasks like data analysis, document processing, visualization generation, and automated insights using natural language prompts, without switching tools.
2. How does the Code Interpreter help analyze Dataverse data?
With the Code Interpreter enabled, users can analyze Dataverse tables by typing simple prompts. Copilot processes the data using Python, generates visual summaries such as charts or graphs, and returns a clear natural-language explanation for faster decision-making.
3. How do I enable the Code Interpreter in Copilot Studio?
You can turn on the Code Interpreter through the Power Platform admin center by navigating to Copilot → Settings → Code generation and execution, selecting your environment, and switching it On.
4. Can I generate visualizations from Dataverse using natural language?
Yes. By creating a prompt and linking Dataverse tables, Copilot can generate visual insights such as bar charts, box plots, or trend visuals using Python by automatically converting them into images you can return using adaptive cards.
5. How do agent flows work with Code Interpreter prompts?
Agent flows allow your Copilot agent to call the Code Interpreter prompt automatically. You simply add a Run a prompt action, return the text insights and base64 image, and display them through an adaptive card in the agent’s response.
6. What business scenarios can benefit from the Code Interpreter?
Any role that needs fast, AI-powered data analysis can benefit—such as sales teams analyzing revenue trends, business analysts exploring customer segments, or data professionals automating insights without manual Excel work.
7. What kind of documents can the Code Interpreter process?
According to the blog, it can intelligently process content across Word, Excel, PowerPoint, and PDF, enabling extraction, summarization, and automation workflows within Copilot Studio.
8. Does Copilot provide human-readable insights along with the visuals?
Yes. Copilot combines Python-generated outputs with AI reasoning to deliver clear, human-friendly summaries, making it easier for non-technical users to interpret complex data.
9. How does the Code Interpreter improve productivity?
It reduces manual analysis, eliminates context-switching between tools, automates repetitive tasks, and turns natural language instructions into ready-to-use data insights by accelerating workflows for low-code makers and business users.
10. What types of charts or visuals can be generated?
The blog example showcases a box plot displaying median revenue and quartile distribution by industry. Similar prompts can generate other visual summaries depending on available data and instructions.
Conclusion
The Code Interpreter in Microsoft Copilot Studio bridges the gap between advanced data analytics and conversational AI. By combining Python’s analytical power with Copilot’s natural language understanding, users can generate instant insights, automate complex analysis, and present data visually, all within a single platform.
Whether you’re analyzing sales data, generating reports, or building smart automations, this feature empowers teams to move faster and make better, data-driven decisions with minimal manual effort.
The post Visualize Dataverse Insights Using Code Interpreter in Microsoft Copilot Studio first appeared on Microsoft Dynamics 365 CRM Tips and Tricks.
Original Post https://www.inogic.com/blog/2025/11/visualize-dataverse-insights-using-code-interpreter-in-microsoft-copilot-studio/