

Now Reading: Let your data talk for you – Interactive Power BI in Power Point
-
01
Let your data talk for you – Interactive Power BI in Power Point

One of the new feature released during the Microsoft Build 2022 session is to have interactive Power BI report pages (or tiles) in Power Point. This enables users to play with and better understand the story from the visuals in Power Point. Here is how easy it is using Microsoft 365 and Power BI –
| Insert Power BI Add-in |

3. Once the Power BI account is done you can see the report page in your Power Point. This has all the functionality as in Power BI you can filter / slice the data in Power Point.
 |
| Play with your data in Power Point |
4. There is also a Power BI toolbar at the bottom which allows you to perform certain Power BI functions directly from Power Point. The Data Options from the toolbar is shown below –
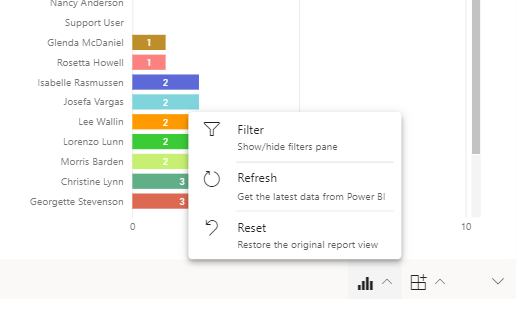 |
| Data Options |
 |
| Add Filters / Insights |
Original Post https://365withoutcode.blogspot.com/2022/05/let-your-data-talk-for-you-interactive.html


