Now Reading: How to Monitor Power Platform Resources Using Alerts
-
01
How to Monitor Power Platform Resources Using Alerts
Overview
Managing a large-scale Microsoft Power Platform environment can be challenging, especially when it involves multiple Dynamics 365 CRM applications used across sales, service, and marketing teams. Performance issues such as slow loading, app crashes, or access failures can often go unnoticed until they escalate, impacting productivity and user experience.
To address this challenge, the Alerts feature in the Power Platform Admin Center provides a proactive way to monitor resource health and application performance. By setting up alerts, administrators can detect and resolve issues before they affect end users, ensuring higher uptime and smoother operations.
Business scenario
A global organization leveraging Dynamics 365 CRM for day-to-day operations faced recurring issues where users encountered delays or errors while opening model-driven apps. Often, these incidents went unreported until they disrupted workflows and caused frustration among teams.
After implementing Power Platform Alerts, administrators began receiving immediate notifications whenever the app’s success rate dropped below 100%. These alerts helped identify potential issues such as connection failures, permission errors, or licensing conflicts, well before users experienced any disruptions.
This proactive monitoring drastically improved reliability, minimized downtime, and enhanced user confidence across the organization.
How Power Platform Alerts work?
Prerequisites
To configure and manage Power Platform Alerts:
- The admin must have Tenant or Environment Administrator
- The target environment must be of Managed Type.
Step-by-step guide to Setting Up Alerts
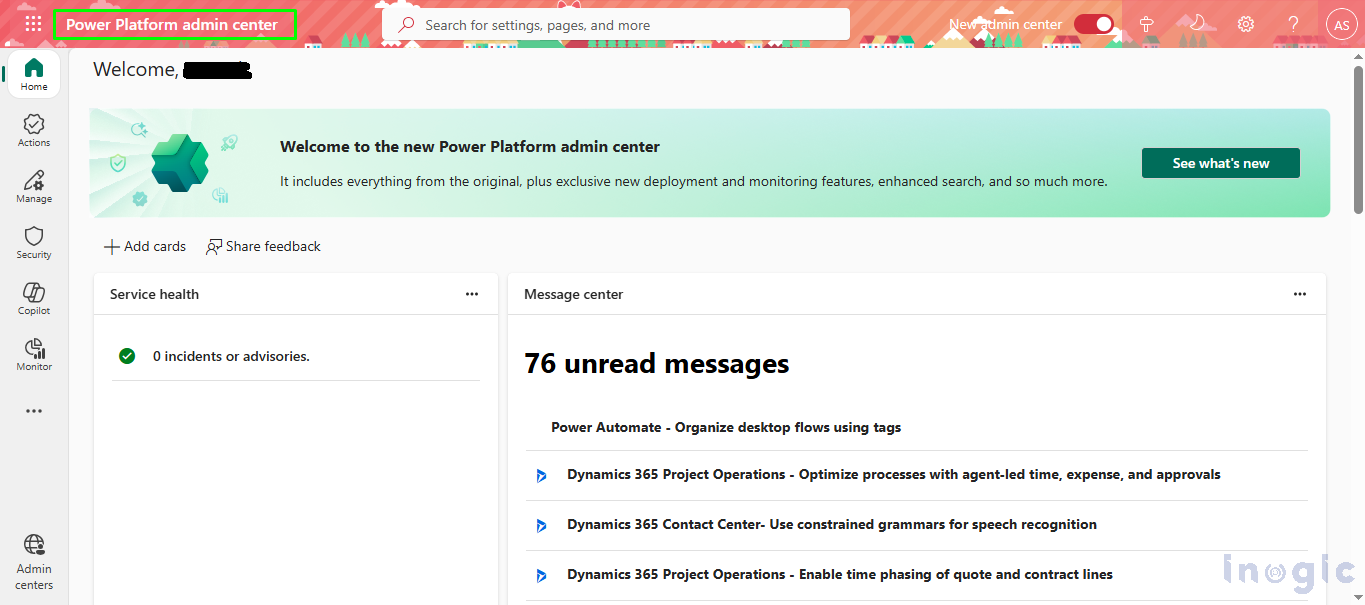
Step 1: Access the Power Platform Admin Center
Open the Power Platform Admin Center and sign in with the appropriate administrator credentials.
Step 2: Navigate to the Monitor Section
From the left-hand navigation pane, select Monitor.
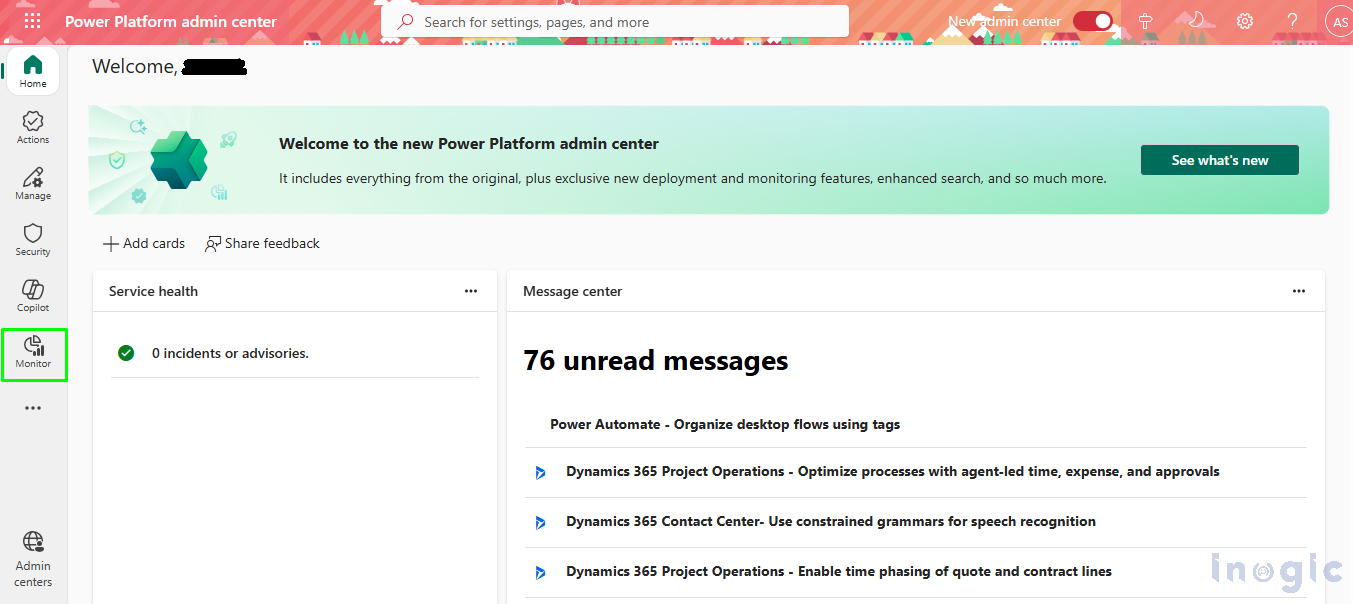
Step 3: Open the Alerts Dashboard
Within the Monitor section, click on Alerts to access the alerts dashboard.
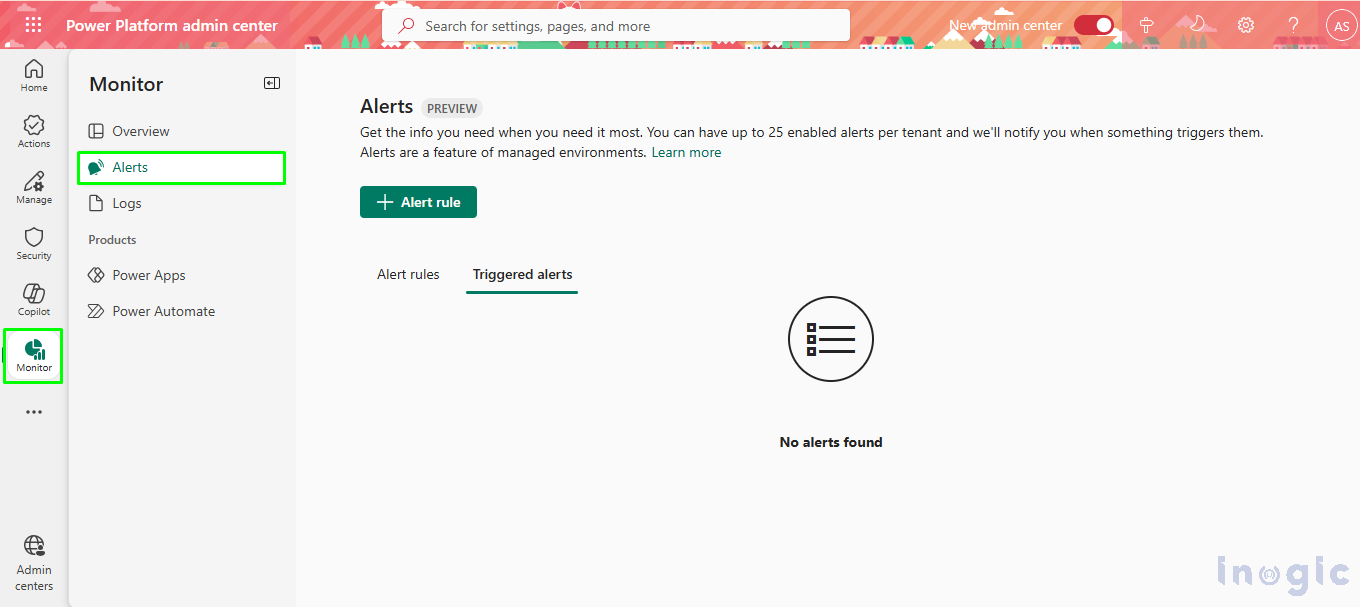
Step 4: Create a New Alert Rule
Click + Alert rule to create a new alert.
A configuration panel will appear where administrators can define the alert’s parameters.

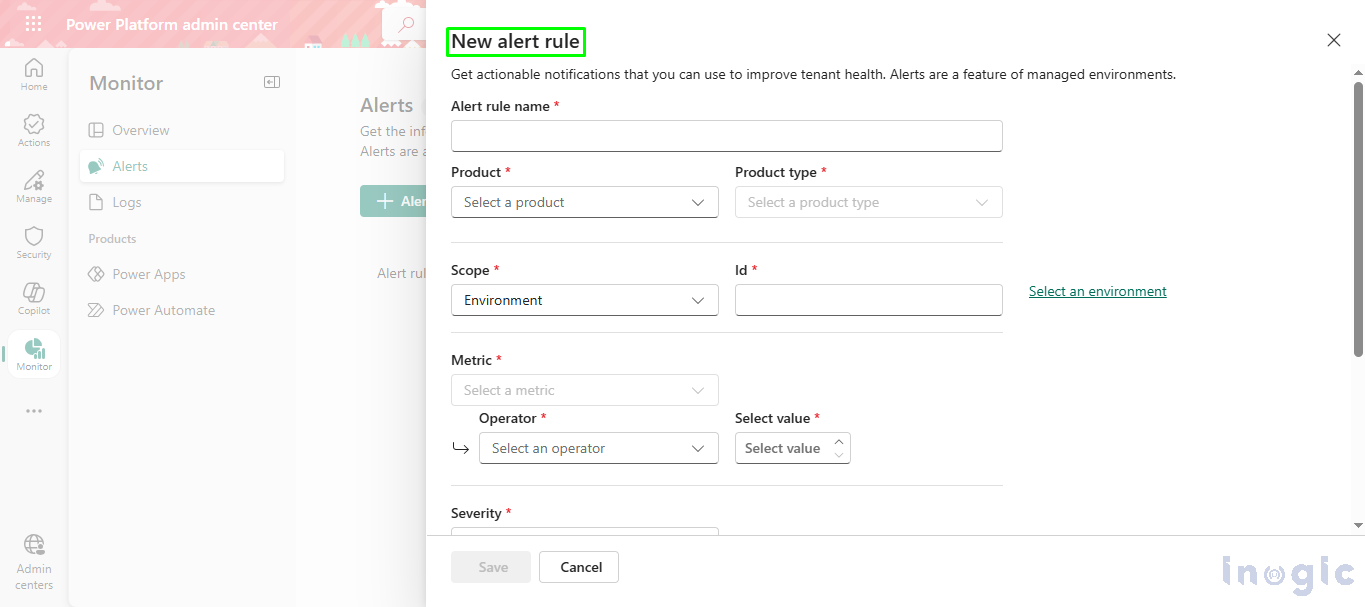
Step 5: Configure the Alert Details
- Name: Enter a clear, descriptive name for the alert.
- Entity to Track: Choose whether to monitor a Power Automate flow or a Power App.
- Scope: Set the scope to Environment and select the target environment.
- Metric and Condition: Select a metric to monitor and define conditions (e.g., “is equal to” or threshold-based triggers).
- Severity: Choose the alert level to Low, Medium, or High.
- Notification Type: Decide whether to receive alerts via Email or view them only in the Admin Center.
Once saved, the system automatically evaluates current data to determine if any alerts should be triggered.
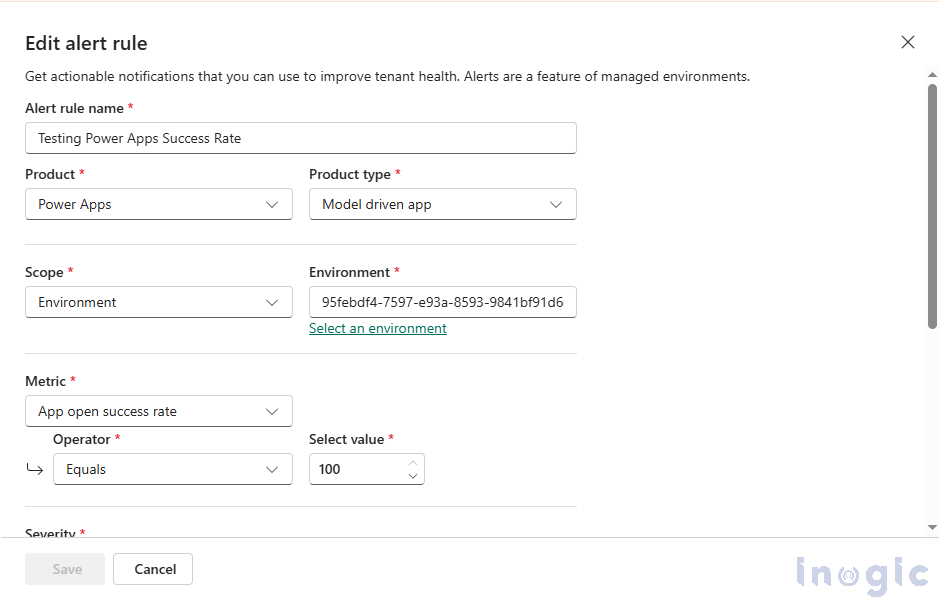
Step 6: Define Metrics, Conditions, and Notifications
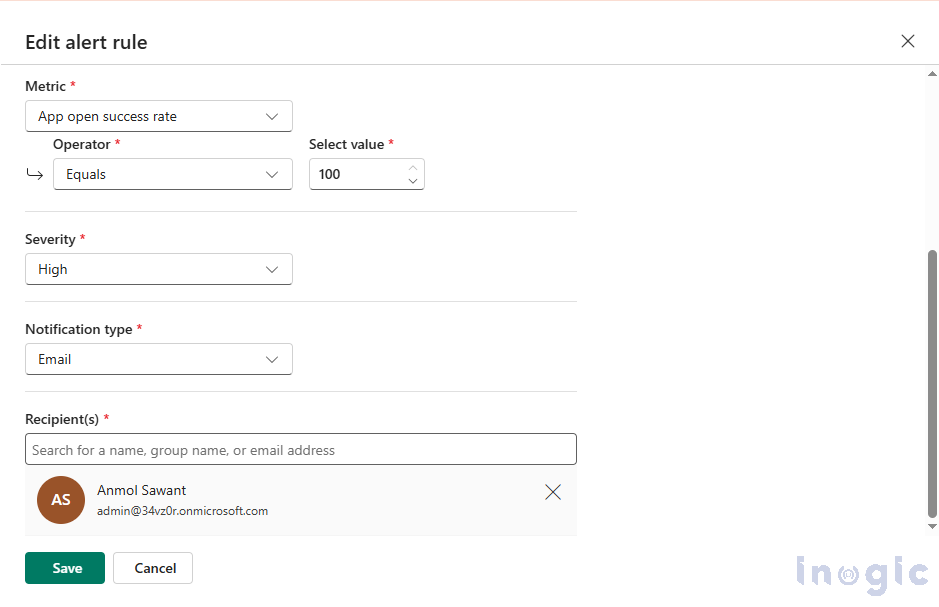
Select the metric to be monitored and set the trigger condition, such as “is equal to” a specific value or threshold. Next, choose the severity level for the alert, i.e., to Low, Medium, or High for indicating its importance.
Finally, decide how the alert should be delivered:
- Email Notification: Sends the alert directly to the configured administrator’s email.
- Admin Center Notification: Displays the alert within the Power Platform Admin Center dashboard.
Once configured, the system will automatically evaluate the defined conditions and trigger alerts whenever the monitored metric meets or exceeds the set threshold.
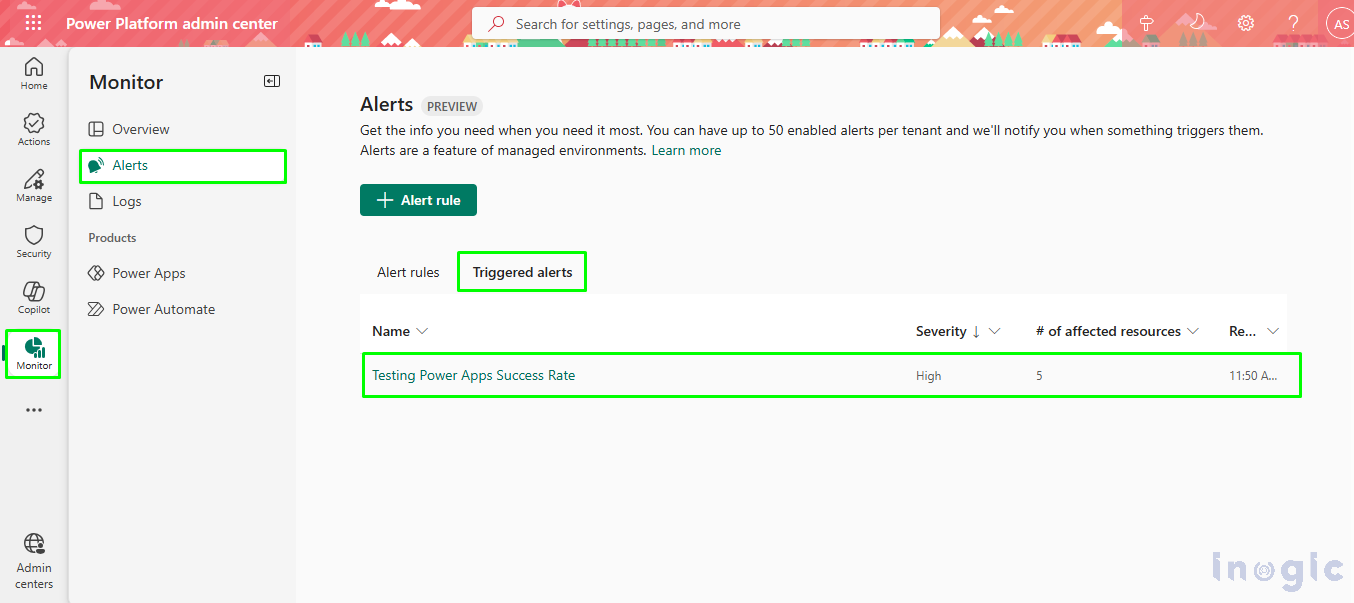
Step 7: Save and Trigger the Alert
Click Save to activate the alert rule. Once saved, the system automatically checks the current data to determine if any alerts need to be triggered.
If the configured conditions are met, the alert will appear on the dashboard according to the defined parameters.
Step 8: Receive Email Notifications (If Configured)
If the email notification option was selected while setting up the alert rule, an alert message will be sent to the administrator’s registered email address whenever the rule is triggered.
This ensures that admins are promptly informed of any performance issues or failures, even without logging into the Admin Center.

Step 9: Access the Triggered Alert in the Admin Center
Click Open Triggered Alert in the email or notification panel to navigate directly to the Power Platform Admin Center.
This link provides a quick way to review the triggered alert and perform further diagnostics.

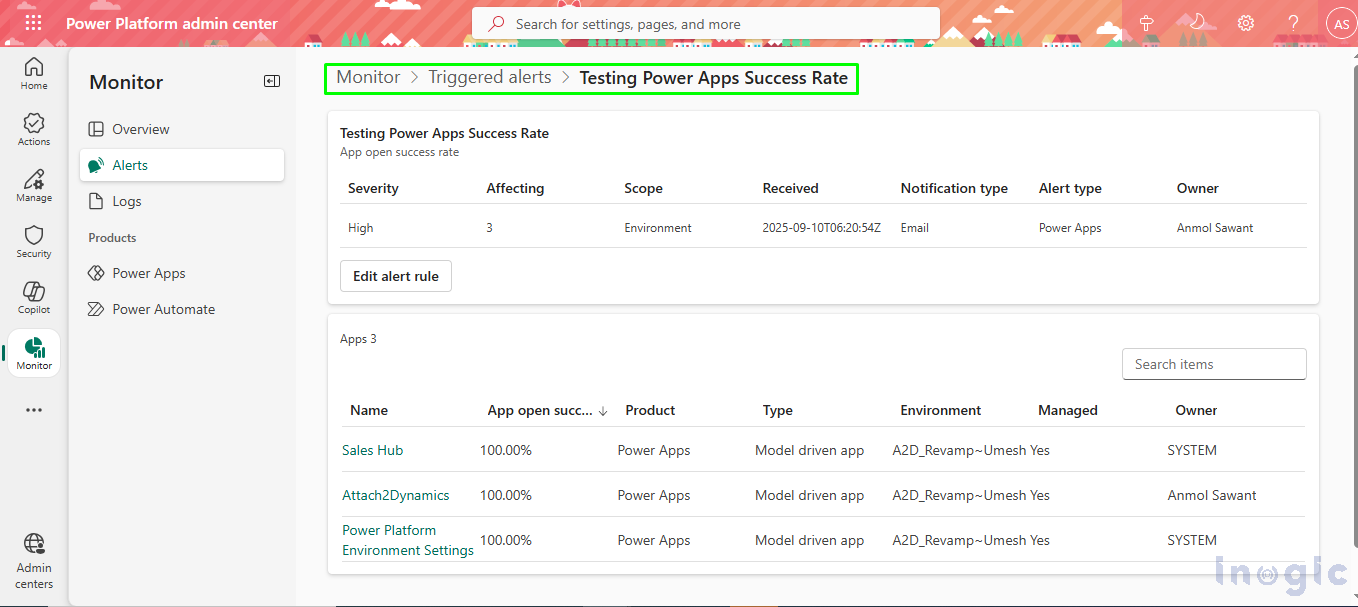
Step 10: Review Detailed Alert Information
Within the Admin Center, detailed information about the triggered alert can be viewed, including the specific model-driven app, alert type, timestamp, and record owner.
This detailed insight allows administrators to identify the root cause quickly and take corrective actions to restore normal performance.
FAQs
- What are Power Platform Alerts?
Power Platform Alerts are automated notifications that help administrators monitor the performance, availability, and health of Power Platform components such as Power Apps, Power Automate flows, and environments. - Who can configure Alerts in Power Platform?
Only users with Tenant Administrator or Environment Administrator roles can configure and manage alerts. The environment must also be of Managed Type to enable monitoring. - Can alerts be configured for specific apps or flows?
Yes. Administrators can choose specific model-driven apps, canvas apps, or flows to monitor by defining their metrics and conditions during alert configuration. - How are alerts delivered to admins?
Alerts can either appear in the Power Platform Admin Center or be delivered via email notifications, depending on the settings chosen during configuration. - What happens when an alert is triggered?
When a configured metric meets the specified condition such as a drop in app success rate, the alert is triggered. Admins can then view detailed information, including the impacted app, issue type, and owner, to take quick corrective actions.
Conclusion
Implementing Power Platform Alerts has transformed the way administrators manage and monitor Dynamics 365 CRM environments. What was once a reactive and manual process has evolved into a proactive, automated monitoring system that enhances visibility and control.
By receiving real-time notifications on performance issues, organizations can act swiftly to prevent disruptions, reduce downtime, and maintain user trust. Power Platform Alerts not only strengthen operational efficiency but also ensure that mission-critical applications remain reliable and responsive at all times.
The post How to Monitor Power Platform Resources Using Alerts first appeared on Microsoft Dynamics 365 CRM Tips and Tricks.
Original Post https://www.inogic.com/blog/2025/11/how-to-monitor-power-platform-resources-using-alerts/