Now Reading: How to Add a Model-Driven App Chart to a Power Pages Portal using Liquid Code
-
01
How to Add a Model-Driven App Chart to a Power Pages Portal using Liquid Code
How to Add a Model-Driven App Chart to a Power Pages Portal using Liquid Code
Integrating charts from a model-driven app into a Power Pages portal can enhance data visualization and improve user experience by providing real-time insights directly within the portal. In this blog, we’ll walk through the process of adding a chart to a Power Pages portal using Liquid code ensuring a seamless experience for portal users.
Use Case: Displaying Industry-Wise Account Distribution in a Customer Portal
A company using Dynamics 365 CRM wants to provide its business partners and stakeholders with insights into the industry distribution of their customer base. The Accounts entity in the model-driven app stores information about customers, including their Industry field, which categorizes them as Manufacturing, Healthcare, IT Services, etc.
By embedding an Industry-Wise Account Distribution chart into the Power Pages portal using Liquid code, the company can:
- Show partners a breakdown of how many customers belong to each industry.
- Help sales teams target industries with lower penetration for expansion opportunities.
- Enhance transparency by giving stakeholders real-time insights into market segments.
This approach ensures that users can access relevant business data in a structured and visually appealing way, without needing direct access to the CRM system.
Implementing the Chart in a Power Pages Portal
To add the chart to the portal, we will use the Liquid code method. If you’re new to Liquid code, you can refer to the official documentation for more details.
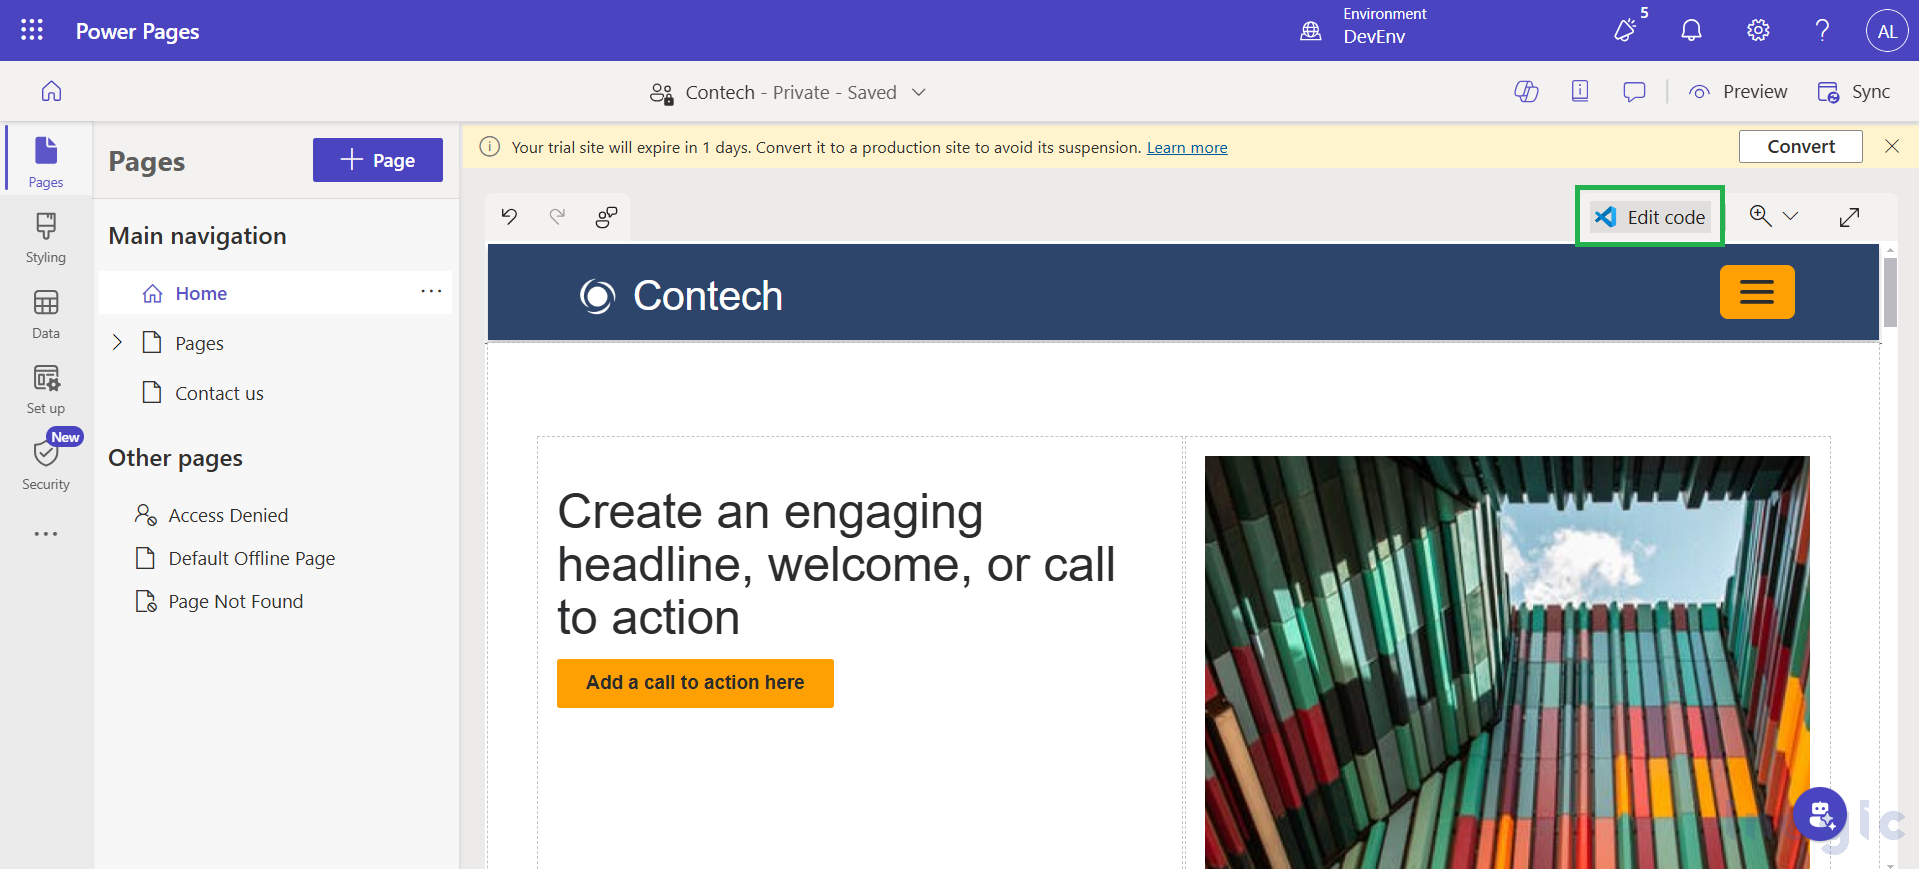
Now, let’s implement this in our Power Pages portal. For this demonstration, I have created a portal using a predefined template. To begin editing, open Visual Studio and navigate to the Edit Code section.
To implement the chart to the power pages portal, you must specify the values for both the chart id and the viewid parameters to render a chart on a portal.
To display an Industry-Wise Account Distribution chart filtered for active accounts in a Power Pages portal using Liquid code, you can use the following:
{% chart id:”YOUR_CHART_GUID” viewid:”YOUR_ACTIVE_ACCOUNTS_VIEW_GUID” %}
Steps to Get the Chart ID
1. Navigate to the Target Entity
- Go to Accounts in your model-driven app (e.g., Sales > Accounts).
2. Access the Charts Section
- Expand the Charts area in the entity view.
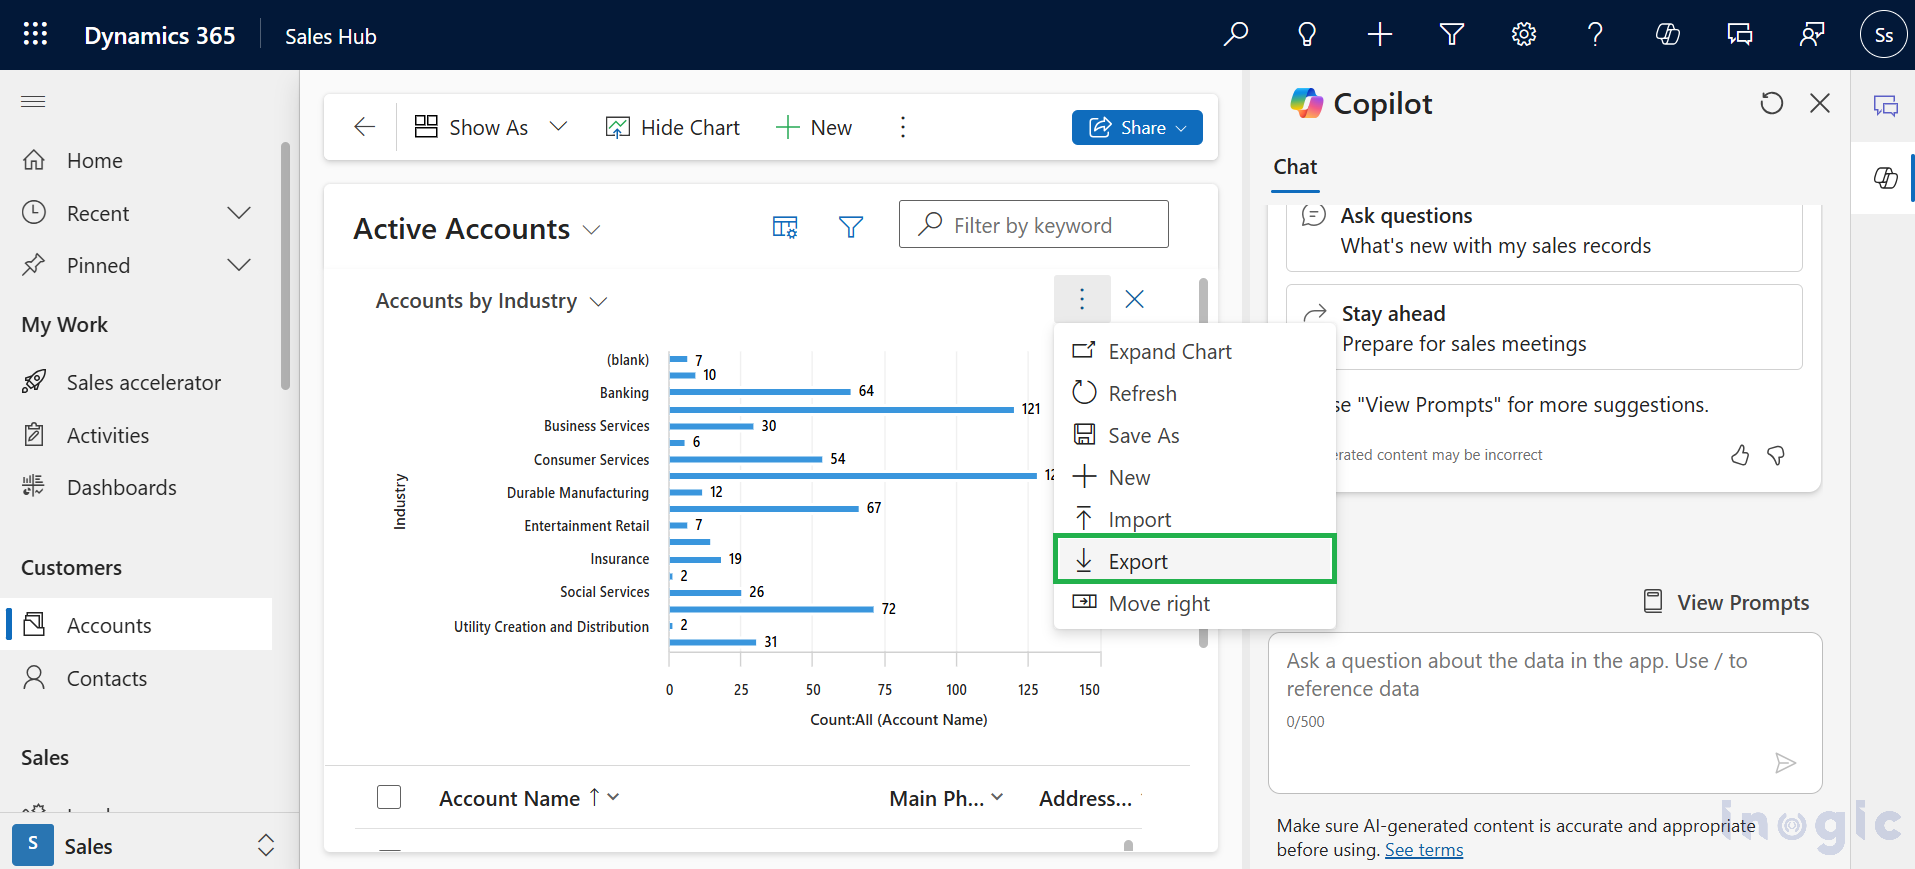
3. Select and Export the Chart
- Choose the Accounts by Industry
- Click More Commands (⋮) > Export Chart to download an XML file.
4. Extract the Chart ID
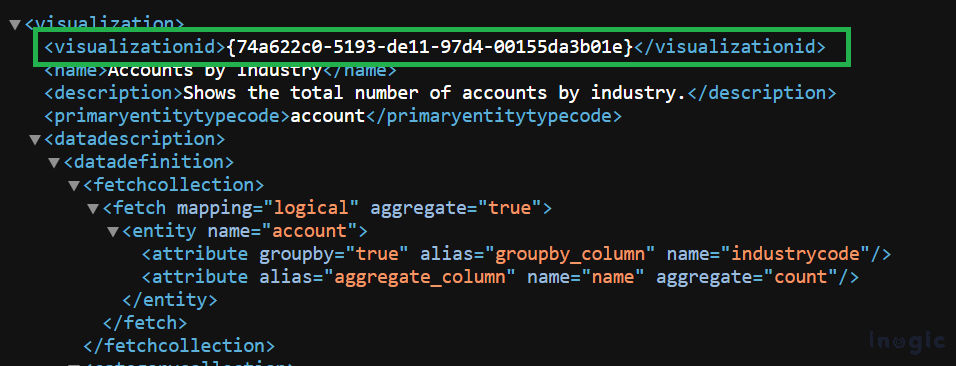
- Open the exported XML file in a text editor (e.g., Notepad++, VS Code).
- Find the <visualizationid> tag and copy the GUID inside it.
5. Use the Chart ID in Liquid Code
- Replace YOUR_CHART_GUID with the copied visualizationid value in your Liquid tag
Steps to Get the View ID for Active Accounts:
1. Go to the Accounts Entity
- Open your model-driven app and navigate to Sales > Accounts (or wherever the Accounts table is).
2. Select the “Active Accounts” View
- Click on the view selector and choose Active Accounts from the dropdown.
3. Get the View ID from the URL
- Look at the URL in your browser.
- The viewid will be present as a GUID after viewid= in the URL.
4. Copy the GUID after viewid= (e.g., 00000000-0000-0000-00AA-000010001006).
5. Paste the copied View ID into your Liquid tag
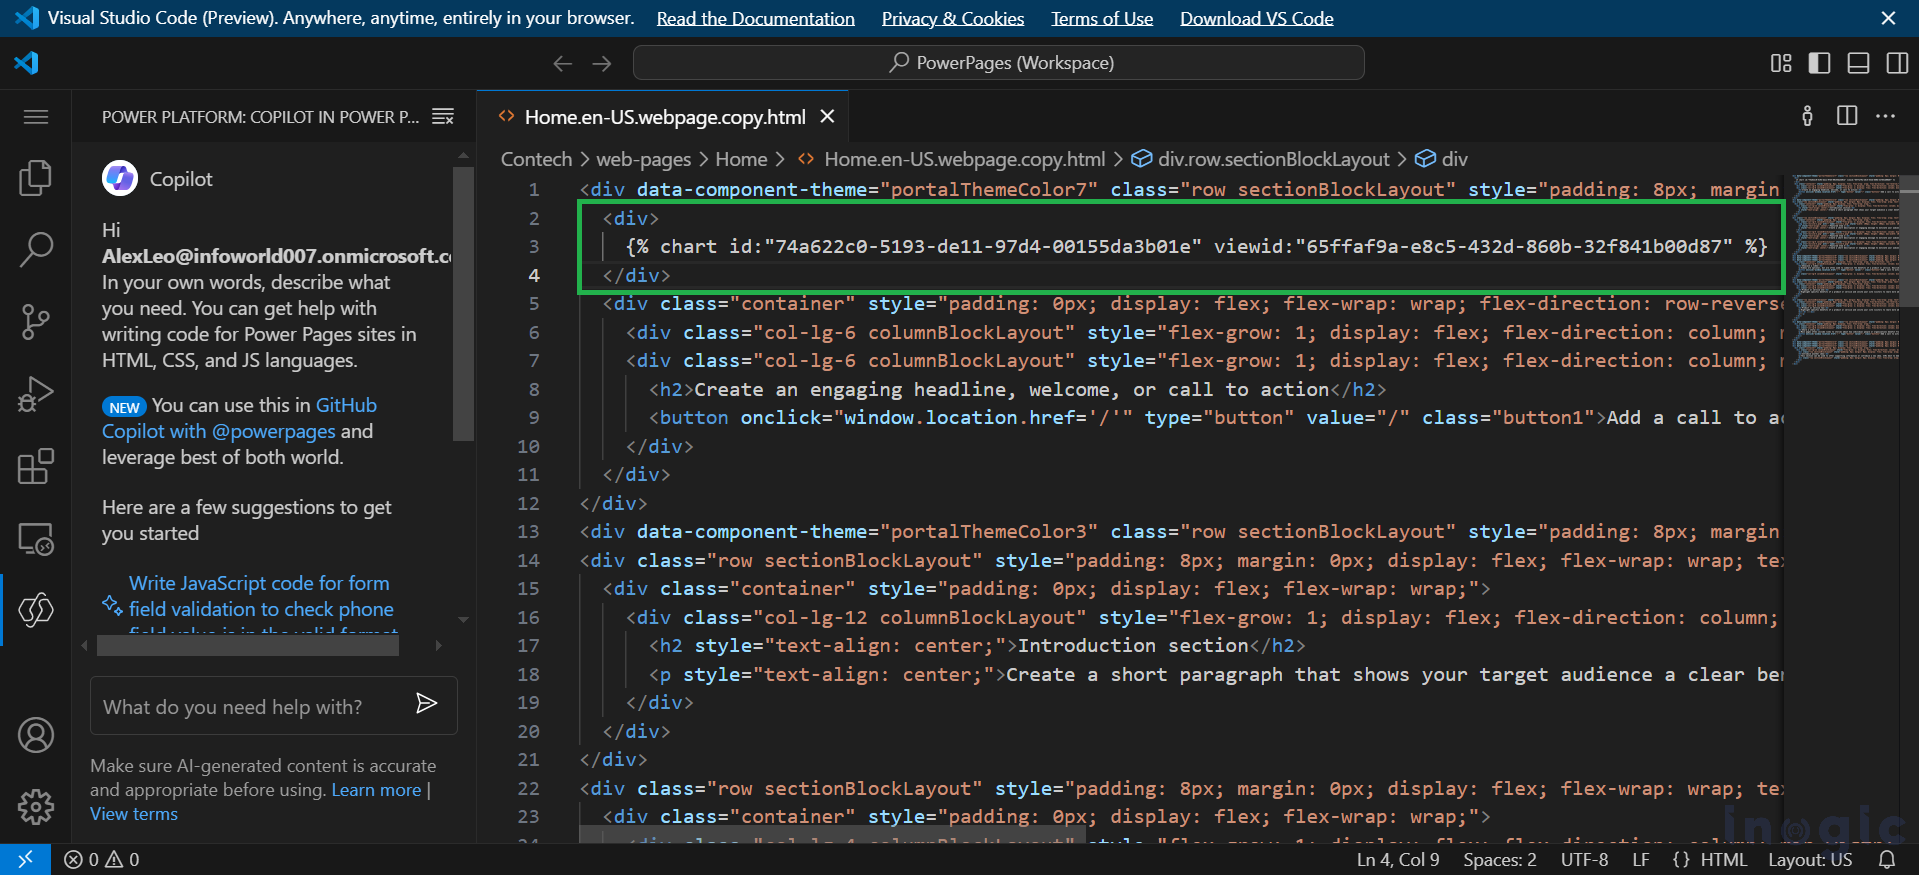
{% chart id:”74a622c0-5193-de11-97d4-00155da3b01e” viewid:”65ffaf9a-e8c5-432d-860b-32f841b00d87″ %}
To integrate the chart into your Power Pages portal, add the following Liquid code to the HTML file in Visual Studio Code. Refer to the screenshot below for guidance. Once added, save the changes to apply the updates to your portal.
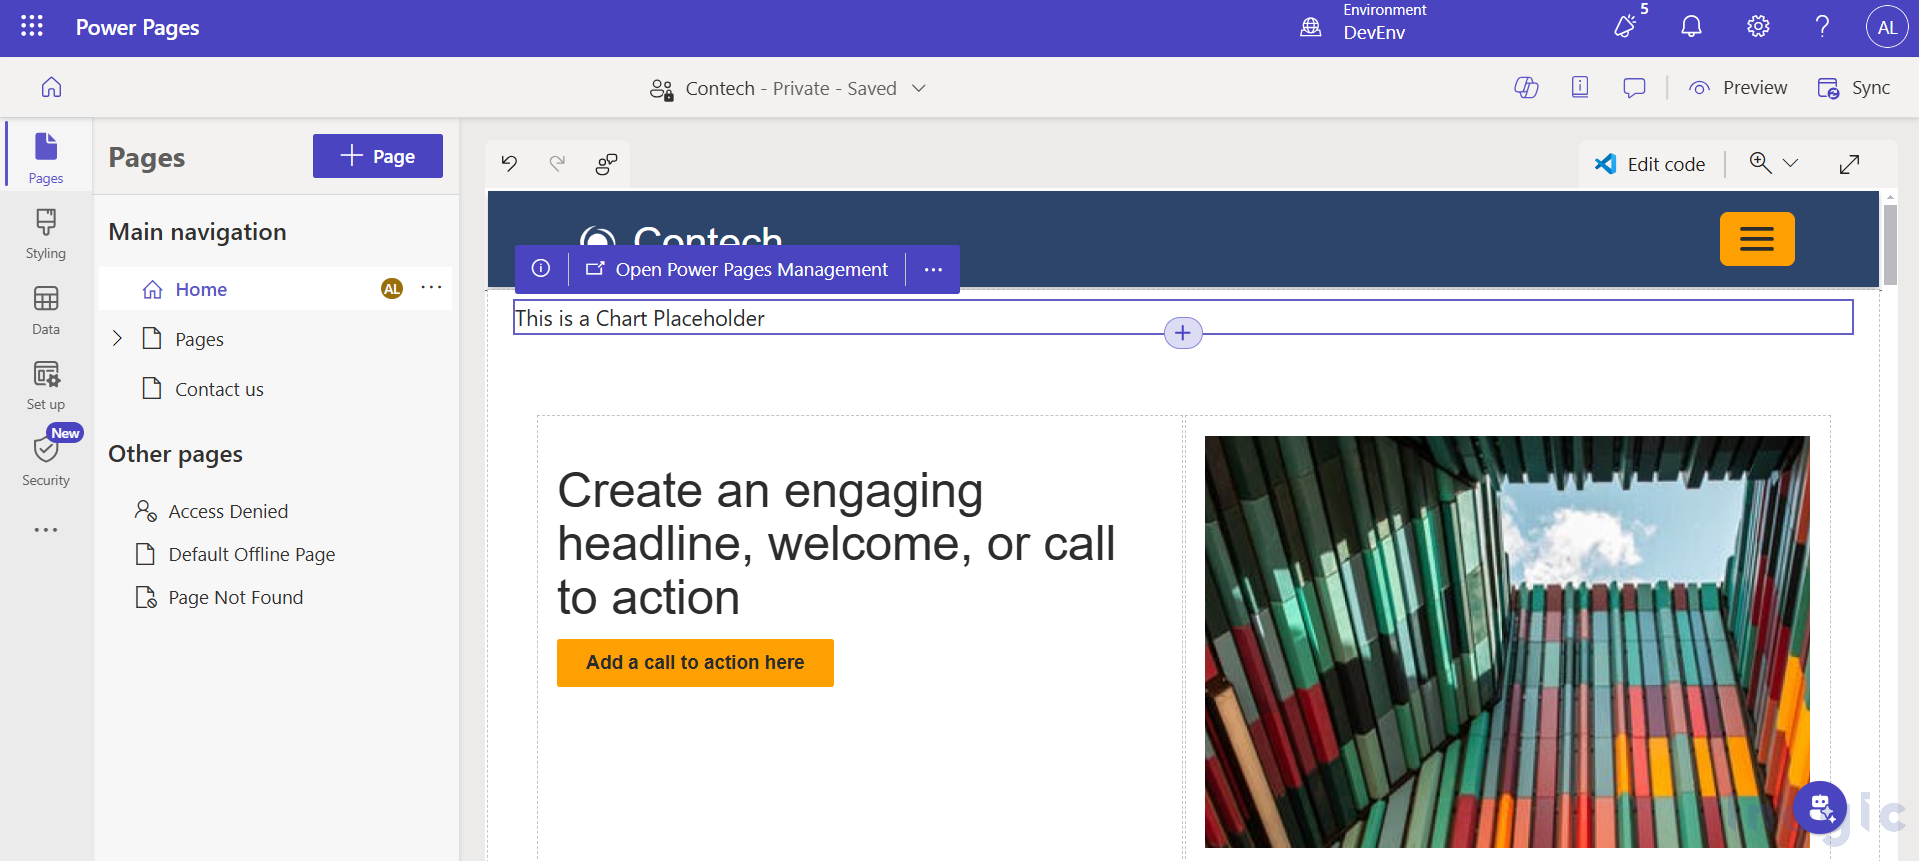
After adding the chart, you will see a component labeled “This is a Chart Placeholder.” This indicates that the chart has been successfully added but is not yet fully rendered. Ensure that the chart ID and view ID are correctly configured, and verify that the necessary Table Permissions are assigned. Once everything is set up, the chart will display real-time data from your model-driven app in the Power Pages portal.
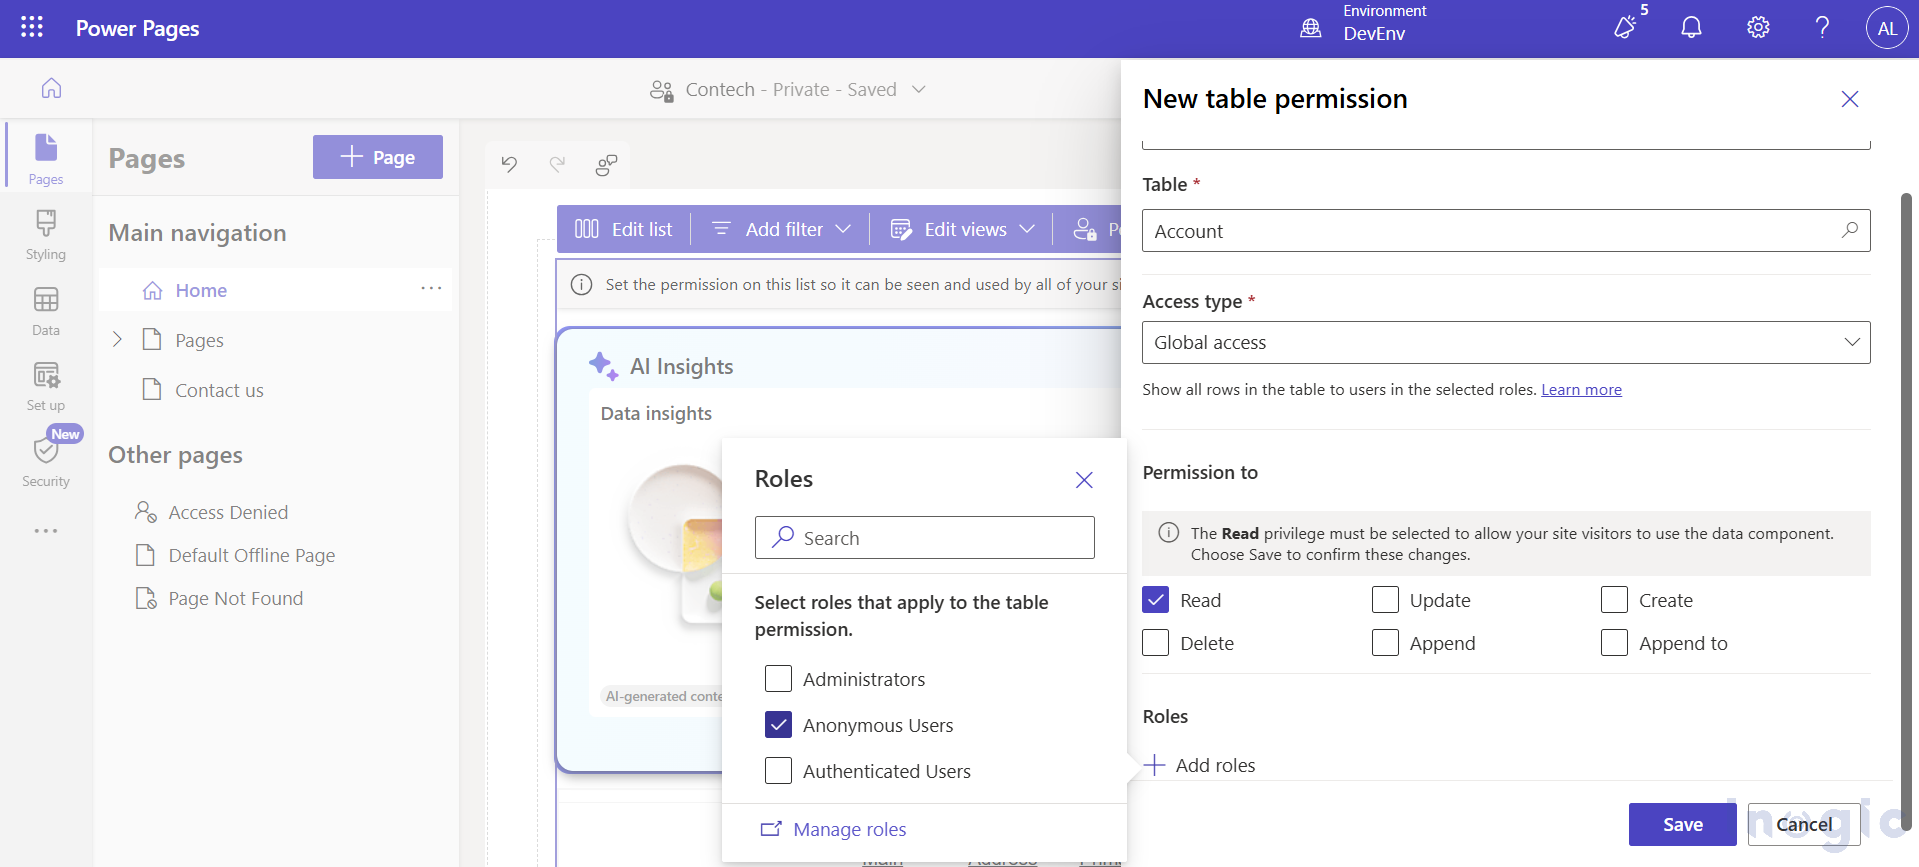
Configuring Table Permissions for Chart Access
The chart requires Read privileges for the target table being queried. To allow anonymous or authenticated users to view the chart in the Power Pages portal, you must set up the appropriate Table Permissions and assign them to the relevant web roles.
If these permissions are not configured, users will see an access denied message.
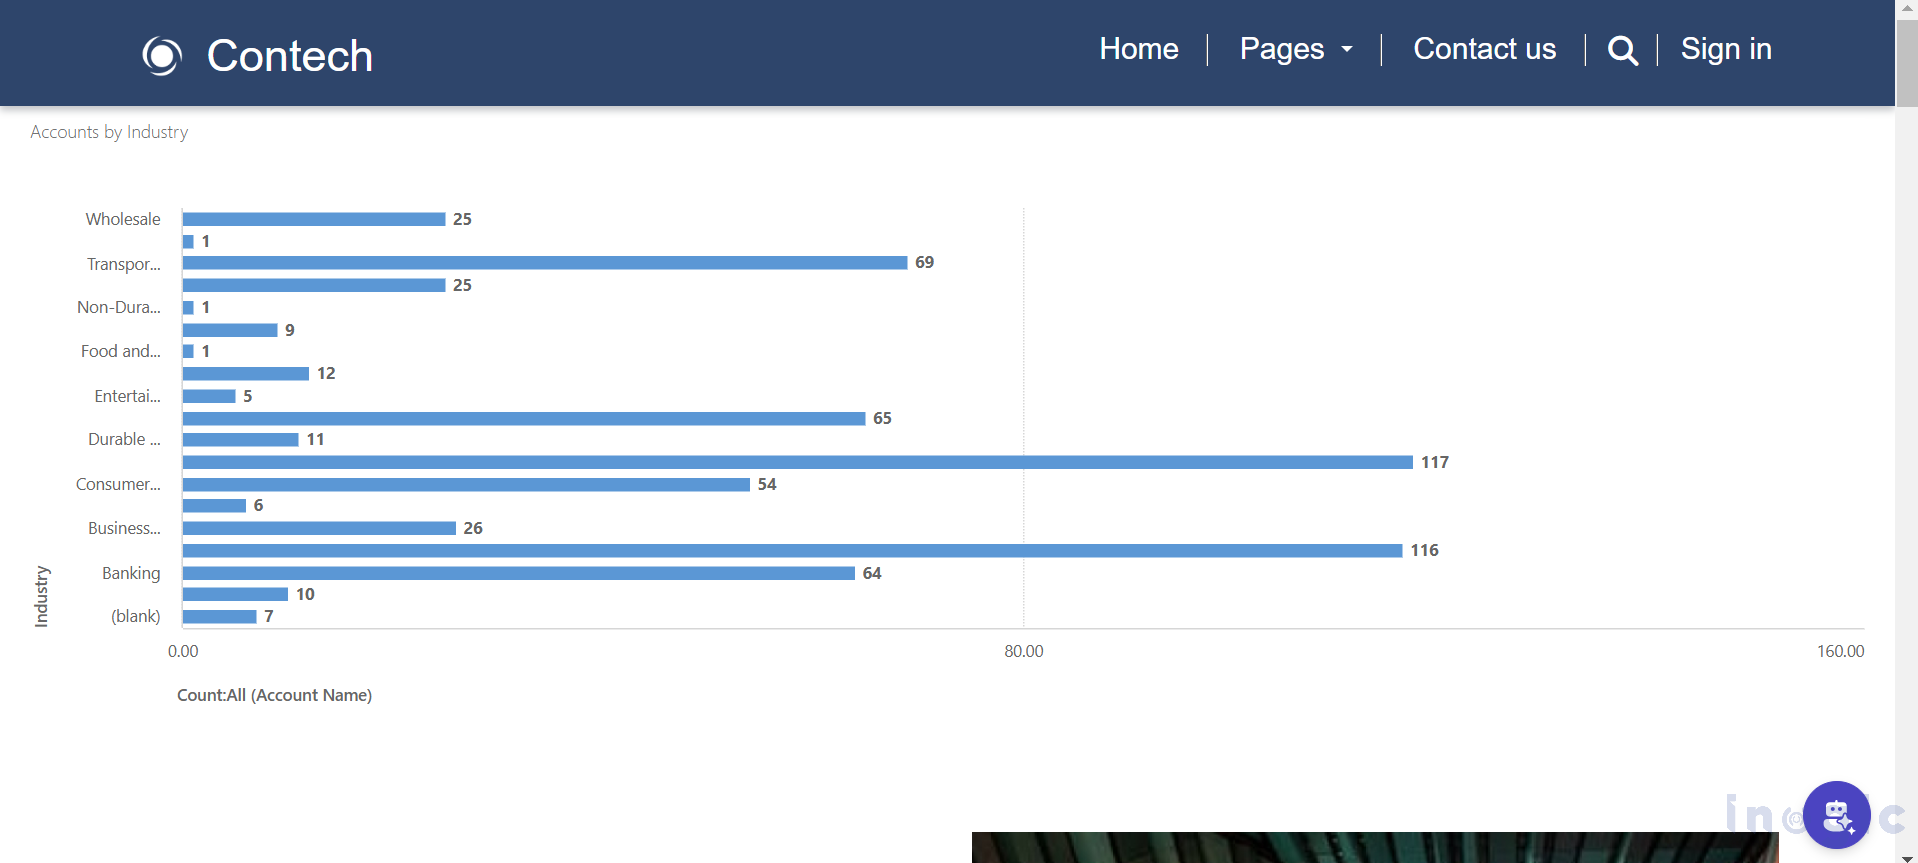
Now, let’s preview the Power Pages portal in a web browser to verify the configured chart on the website. The screenshot below showcases the chart successfully implemented using Liquid code.
Some charts and chart types are not supported in Power Pages. To check the list of supported and unsupported charts, please refer to the official documentation using the link.
Conclusion
Integrating a model-driven app chart into a Power Pages portal using Liquid code improves data visualization and enhances the user experience. By following the outlined steps, you can easily embed charts, set up the required Table Permissions, and ensure proper user access.
Before implementation, verify supported chart types and configure permissions to prevent access issues. This method enables you to build a dynamic, data-driven portal, offering real-time insights without exposing direct CRM access.

The post How to Add a Model-Driven App Chart to a Power Pages Portal using Liquid Code first appeared on Microsoft Dynamics 365 CRM Tips and Tricks.
Original Post https://www.inogic.com/blog/2025/02/how-to-add-a-model-driven-app-chart-to-a-power-pages-portal-using-liquid-code/