Did you know that companies with well-defined sales territories can achieve up to 20% – 25% higher sales productivity compared to those without?
Yet, sales managers often struggle to efficiently visualize, analyze, refine, and manage sales territories—resulting in misallocated resources, overlapping coverage, and missed opportunities.
Imagine having the power to instantly view your sales territories and those of your team members, easily assign regions, create, draft, realign, or save territories, track performance, and optimize sales efforts on an interactive map —no more guesswork, just clear, actionable insights.
The newly enhanced territory mapping features of Maplytics – Microsoft’s certified #1 Geo-Mapping app, are here to simplify how sales managers strategize and allocate resources for better performance tracking. By providing a visual representation of territories and their associated data, this innovative solution empowers sales teams to make smarter, data-driven decisions.
Solve Territory Management Challenges with Maplytics
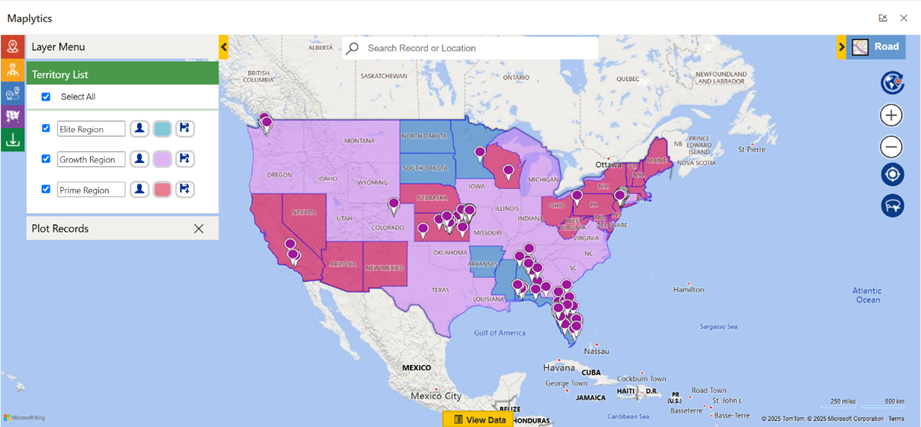
With the new Territory Management feature, users can plot data specific to selected sales territories on a map. You can select multiple existing territories, choose the relevant data source, and instantly visualize the assigned records.
This feature now offers options to plot records from:
- My Territory: View only your assigned territory and its data, allowing sales managers to focus on their specific sales goals and tasks.
- My Team Territory: View territories managed by your direct reports, enabling sales managers to support and monitor their team’s performance effectively.
- Both My Territory & My Team Territory: View your territory alongside those managed by your team, giving managers a complete view of their sales landscape for better decision-making
How does it work in Action? – Get the Inside Scoop
Let’s say, Peter, a Territory Manager in charge of the territory named Growth Region. He oversees two managers—Jack, who manages the territory named Elite Region, and Ava, who leads the territory named Prime Region.
• When Peter selects My Territory, he sees the Growth Region mapped out with all its records.
• When Peter selects My Team Territory, the Elite Region, and Prime Region territories are mapped along with their data, distinguished with different color codes for identification.
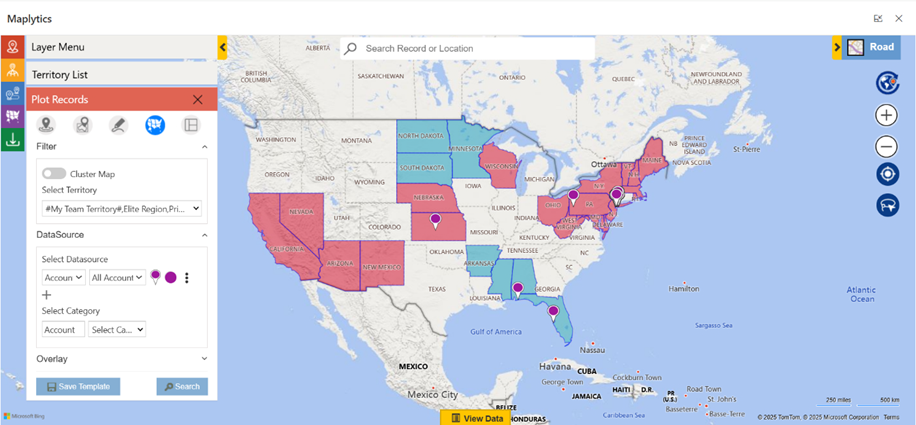
• By selecting both options, Peter can view the Growth Region, Elite Region, and Prime Region all at once.
If Jack logs in and selects My Territory, he only sees the Elite Region. He won’t see any data under My Team Territory since he has no direct reports.
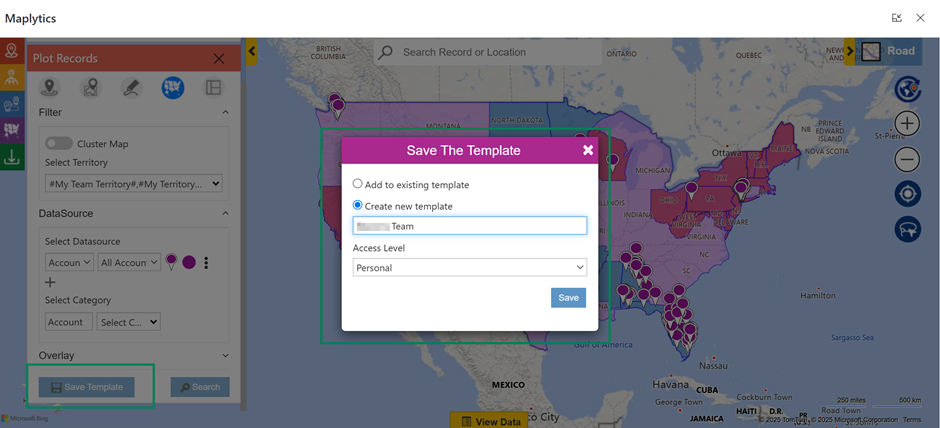
Save Time with Templates and Dashboards
This territory enhancement also allows sales managers to save mapped territories as templates and add them to analytical dashboards. This way, Peter can easily access a visual overview of territories without needing to replot them each time.
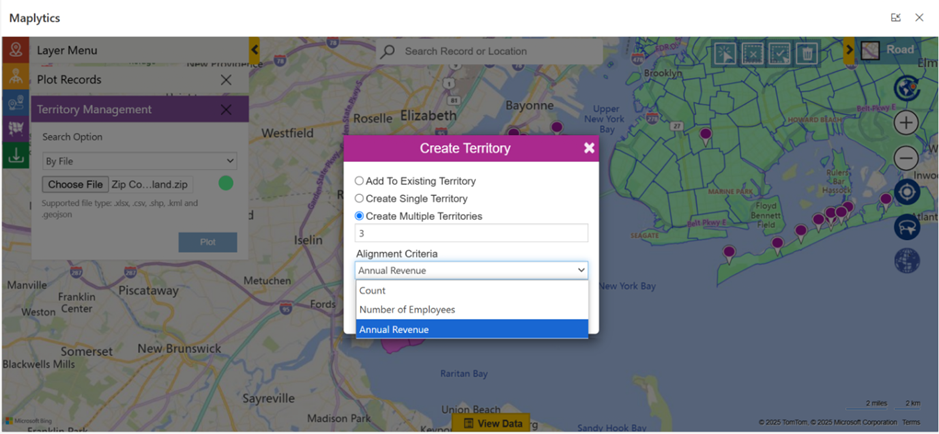
Creating Multiple Territories with Alignment Criteria
With the Alignment Tool, Peter can select multiple regions and choose to Create Territory. Instead of manually creating each territory, he can simply enter the number of territories he wants, and the system automatically divides them into balanced territories. In one instance, he specified three new territories and used Annual Revenue as the alignment criteria. The tool instantly calculated and split the regions accordingly.
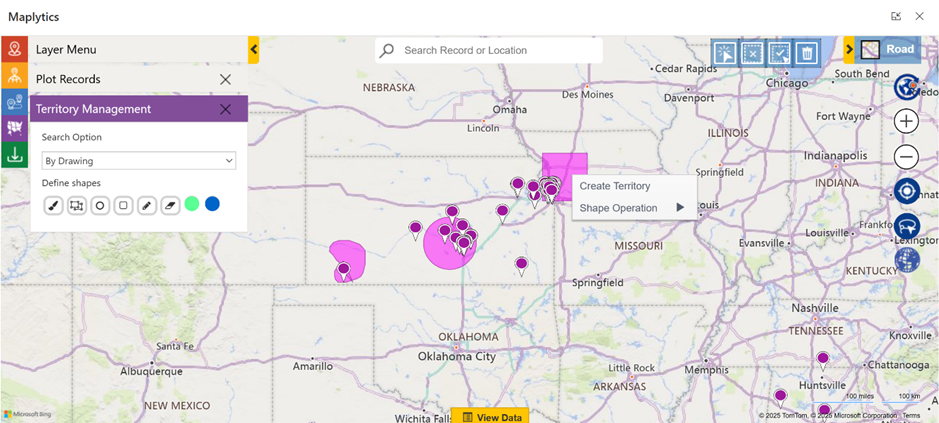
Draft Territories in CRM
Now, Peter wants to explore and test new territories based on postal codes or region clusters. But before making anything official, he needs time to think it through and discuss it with his team.
That’s where the enhanced Draft Territory feature steps in.
Peter can simply draw shapes directly on the map to outline potential territories. These shapes can be saved as drafts—whether they include records (like accounts, leads, etc.) or not. Later, he can open them, review them, make changes, or compare multiple drafts together on the map.
All his draft territories are now neatly stored under a dedicated Draft Territory section. From there, Peter (or any manager) can easily plot them again, make informed decisions, and convert drafts into live territories whenever ready.
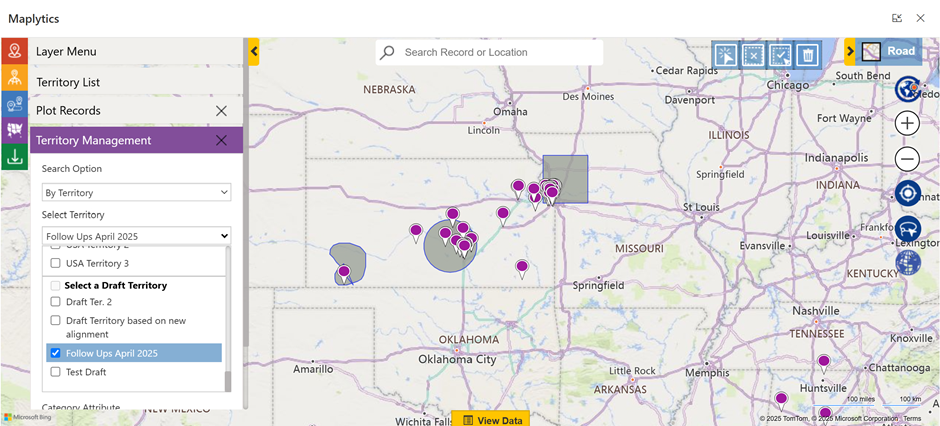
This enhancement gives managers the flexibility to plan smart, test ideas, and finalize only when confident—without losing any of their work in progress.
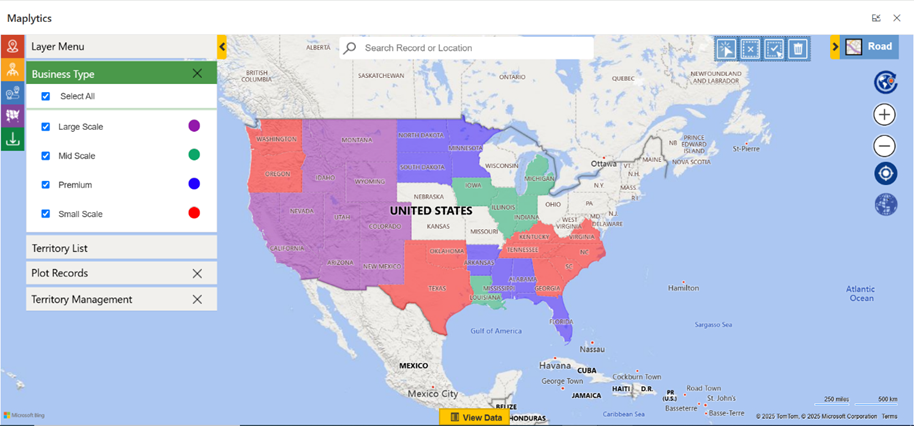
Plot Territory by Category Attribute
With the Territory Mapping feature, Peter can quickly plot existing territories on a map. A dedicated section allows him to view and manage his regions effortlessly. Plus, all territory attributes, including custom ones, are linked to a Category Attribute, making it easier to categorize and analyze territories.
For instance, if Peter selects the Business Type attribute, the map highlights territories with the same category in matching colors. This helps him and his team identify patterns, streamline operations, and make data-driven decisions at a glance.
Achieve Territory Success with Maplytics Geo-Mapping
This powerful feature helps sales managers make data-driven decisions, optimize sales strategies, and boost productivity. By visualizing territories, tracking sales performance, and identifying new opportunities, sales teams can achieve more while managing less.
Ready to transform your territory management process?
Start using Geo-Mapping today and unlock the true potential of your sales territories!
Want to see it in action? Take a 15-day free trial from our website or book a personalized demo to experience its full potential.
Explore our Blogs, Client Testimonials, Success Stories, Industry Applications, and Video Library to see how businesses are leveraging Maps integration for their Dynamics 365 / PowerApps / Dataverse. Have questions? Reach out to our team at crm@inogic.com or visit Microsoft AppSource to get started today!