Dynamics 365 Great Plains
SQL Scripts for Microsoft Dynamics GP: Select Chart of Accounts
This script is part of the SQL Scripts for Microsoft Dynamics GP where I will be posting the scripts I wrote against Microsoft Dynamics…
This script is part of the SQL Scripts for Microsoft Dynamics GP where I will be posting the scripts I wrote against Microsoft Dynamics…
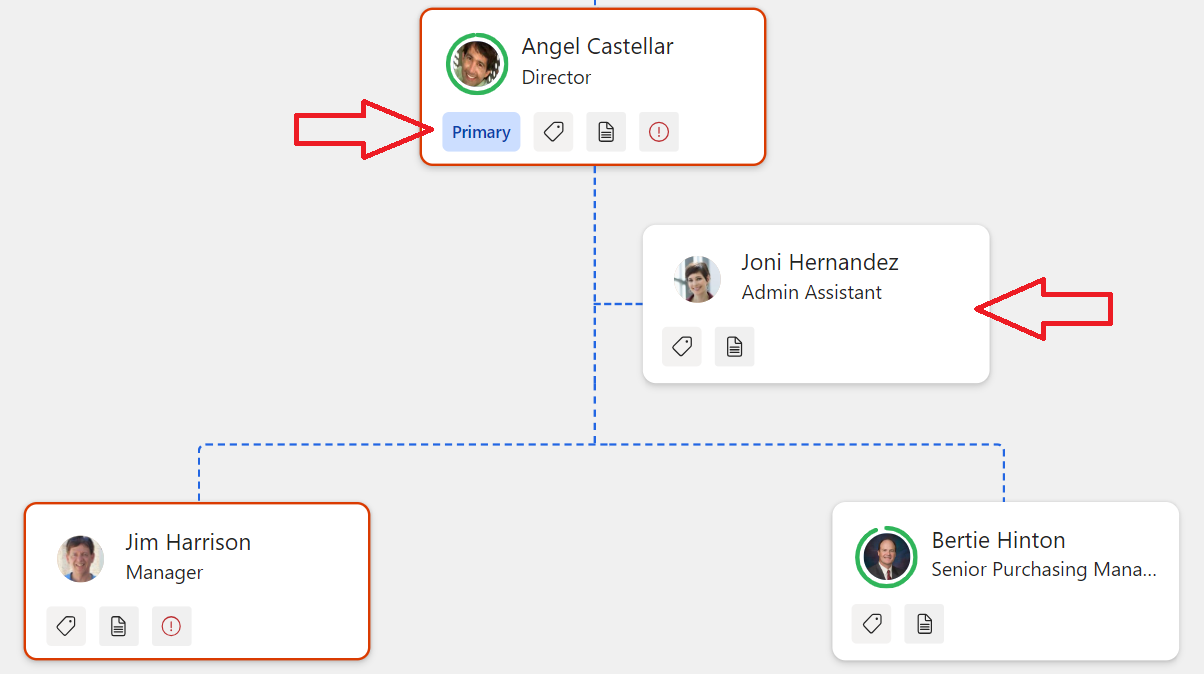
Most people who have worked with Dynamics 365 Sales before probably know about the org chart capabilities in the application. If you’re not familiar,…
Qlik has further expanded the visualization capabilities for Qlik Sense. The Visualization Bundle now includes a new customizable straight table with chart exploration. The…
This post is part of the In Microsoft Dynamics 365 Business Central (Financial), how do I… series and of the wider In Microsoft Dynamics…
This post is part of the In Microsoft Dynamics 365 Business Central (Financial), how do I… series and of the wider In Microsoft Dynamics…