

Now Reading: Silent Imports, Loud Insights — How DIXF Telemetry + App Insights Transform D365FO Diagnostics
-
01
Silent Imports, Loud Insights — How DIXF Telemetry + App Insights Transform D365FO Diagnostics
Silent Imports, Loud Insights — How DIXF Telemetry + App Insights Transform D365FO Diagnostics

In my earlier post ,I had given a walkthrough of configuring Telemetry in D365FO and tracing the logs in Application Insights.
With the latest update from Microsoft on DMF Telemtry , I digged deeper to understand how to gain deeper visibility in DMF executions with the new features
What are the features included:
Monitoring import and export operations with start and end times Tracking job status from source to staging to target Identifying failures with detailed, granular error messages
Make sure you have one of the below builds
Latest builds:
PU72/10.0.48: (build>=7.0.7996.55);
PU71/10.0.47 (build >= 7.0.7858.120);
PU70/10.0.46 (build >= 7.0.7778.129)
DMF Telemtry is controlled by two flights and they are enabled by default.
DMFTelemetryConfigurationFlight
DMFEnableAppInsightsLogsAndErrors
When these are enabled, new telemtery signals appear under ‘Configure’ tab.

If you don`t find these signals in your environment with one of the above builds , contact Microsoft support.
Once these are enabled, you can track the start and end times of your DIXF jobs and also the status.
For instance,I`ve enabled these signals in my environment.

Let us try with an export job.

I am triggering the export of Customer groups
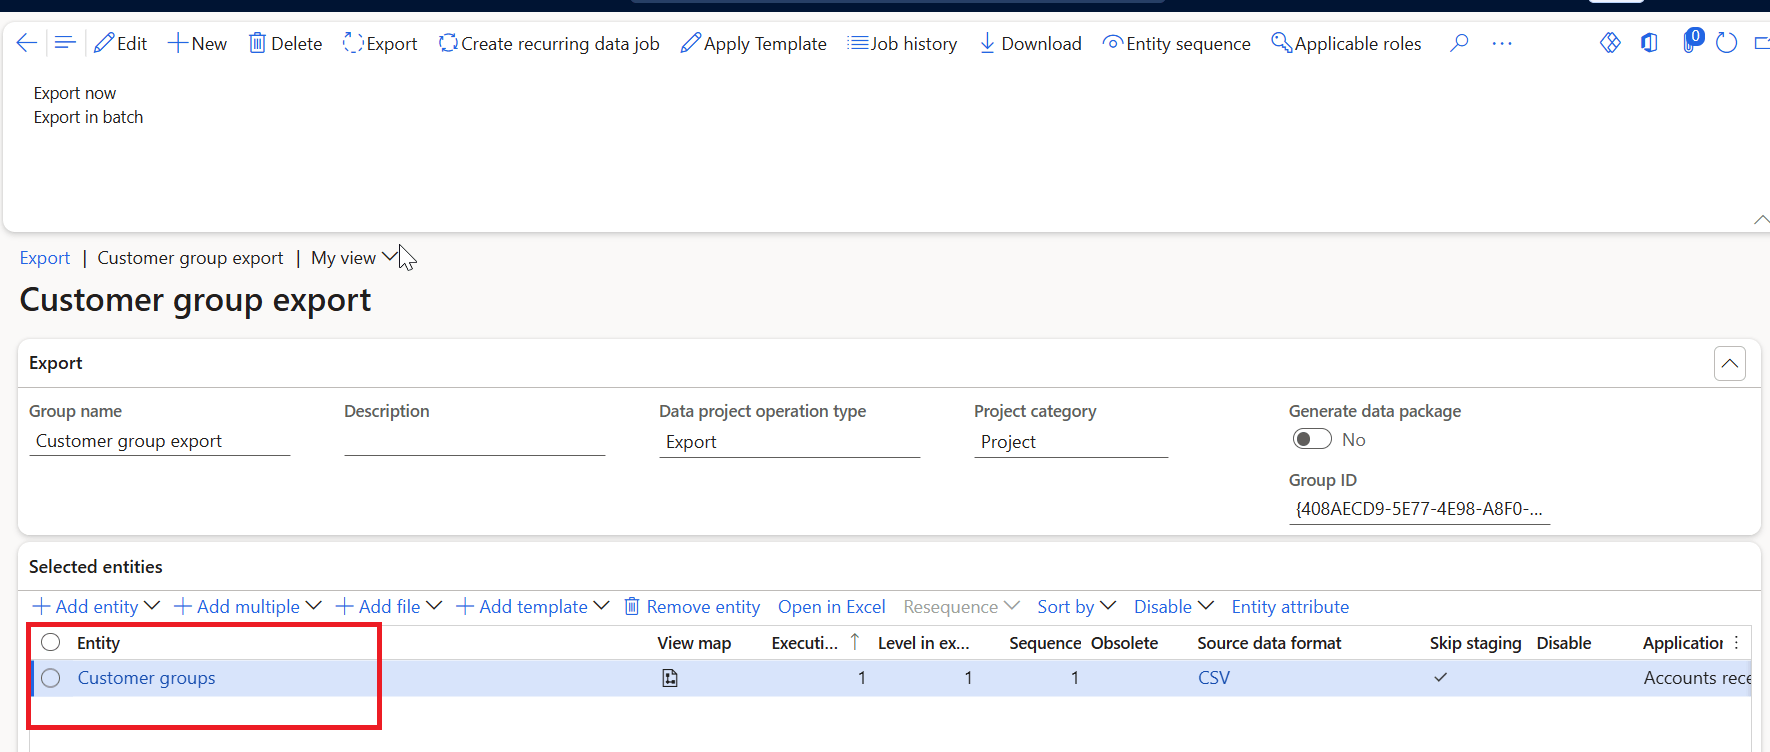
Let us see how telemetry captures this in Application Insights.
Wait for the job to complete.
How to build DMF Telemetry Dashboard?
Using the Azure Data Explorer, a dashboard can be built to visualize Dynamics 365 Finance & Supply Chain Management DMF execution telemetry.
Download the json from github and extract the contents.
Go to Azure Data Explorer.

Click ‘Import Dashboard from file’
and import the downloaded json

The next dialog shows the name of the Dashboard. You can edit the name as per your preference

Hit Create.
The dashboard opens, but the tiles doesnt reflect any data as the data source is not configured.

Click Datasource.

The cluster URI should be modified
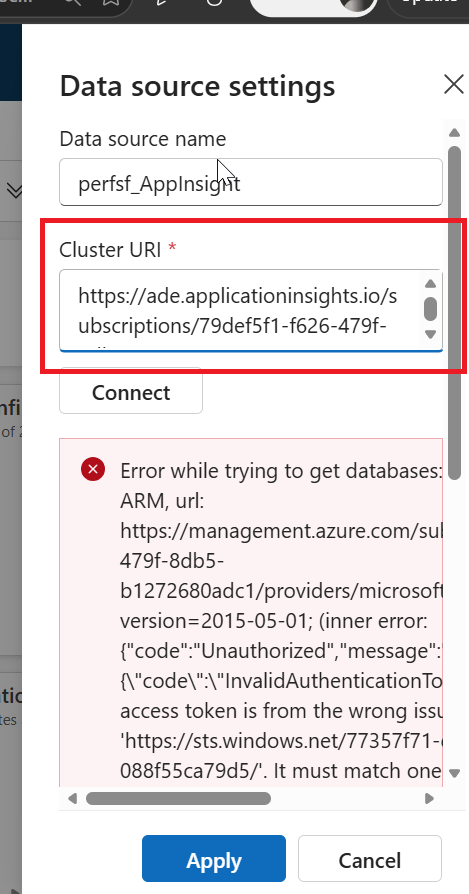
The cluster URI is in the following format

The first part of the URL remains static https://ade.applicationinsights.io
Remaining part of the URL can be retrieved from the App Insights Properties.
Go to your Application Insights -> Properties
Copy the ‘ResourceId’ string

Upon pasting the URL , click ‘Connect’

Hit Apply and the Dashboard will be refreshed without any errors.

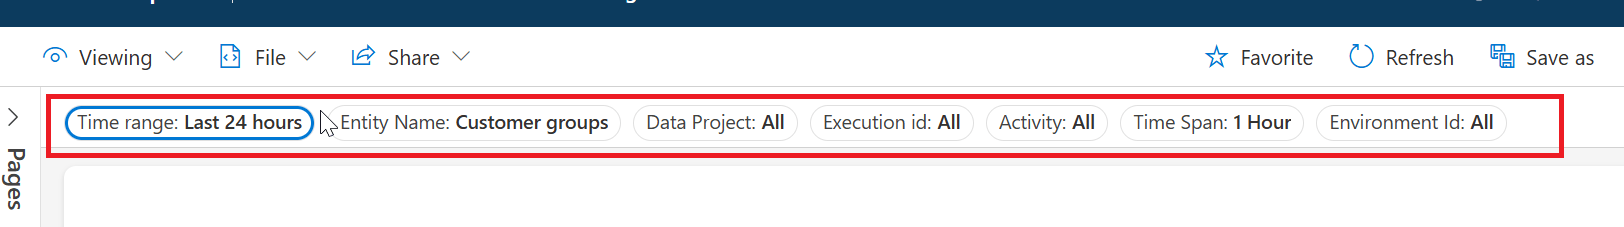
You can change the filter as needed
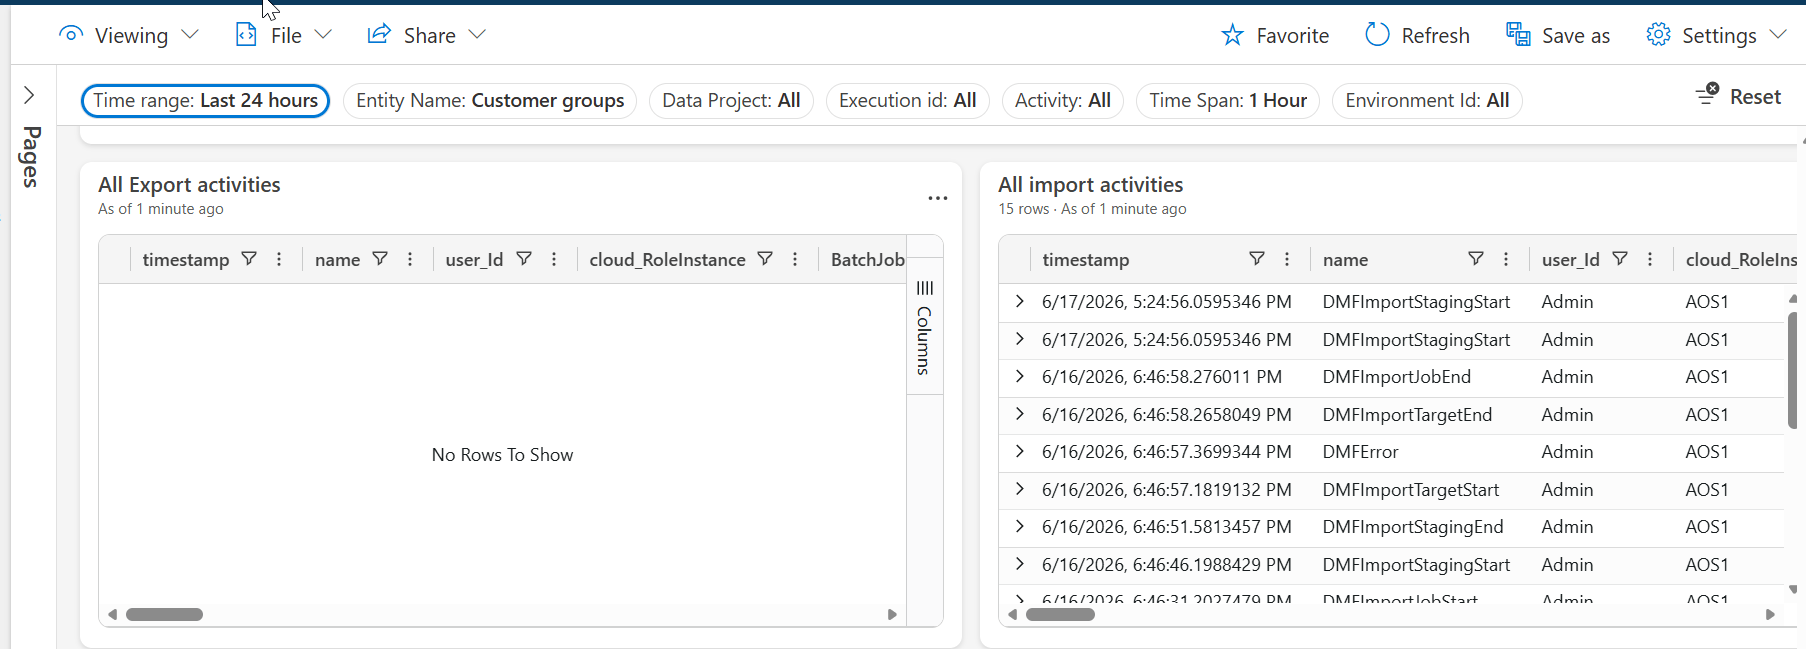
The Dashboard captures all the necessary information to monitor the execution
Try this feature and share your experience.
Attention is a costly affair nowadays. So ending the post with a thought
The person who can hold their focus owns the future.
Original Post https://anithasantosh.wordpress.com/2026/06/17/d365fo-troubleshooters-radar-how-application-insights-exposes-hidden-failures/


